---
layout: post
title: "Data Science and Design Projects for Social Good, Spring 2019"
date: 2019-5-28 03:32:51 -0500
categories: jekyll update
thumbnail: "/~keene/images/dataSci2019/riceBowlCloseUp.jpg"
---
In the spring semester of 2019, [Taylor Woods](https://www.taylorwoods.me/) and I co-taught this years iteration of Data Science and Design Projects for Social Good.
Our purpose was to educate Cooper Union students to solve real world, data-oriented problems in education, equality, justice, health, public safety, economic development or other areas. By partnering with nonprofits, social enterprises or government agencies, students learned to apply data science, machine learning, and software engineering principles to problems that have significant social impact. Through this effort, we hoped to fulfill part of Peter Cooper’s vision, to instill into students a sense of social justice that will translate into action.
We partnered with four non-profits based in the NYC area, and formed five groups of students. Each group had representation from the schools of art and engineering. Over the course of the semester, the teams performed an exploratory data analysis, proposed avenues of inquiry, and reported their results in the form of reports, presentations, visualization and interactive exhibits. In-class critiques were held and members of from a wide range of industries such as architecture, business consulting, graphic design and software engineering were invited.
The projects spanned topics such as housing inequity, food insecurity, gun safety and recidivism. The work was presented to the particpating non-profits, and guests, at the end of the semester. Additionally much of the work was shown at the [End of Year Show](https://cooper.edu/events-and-exhibitions/exhibitions/student-exhibition-2019). A few images exhibition, followed by short descriptions and more information about each project, are below.
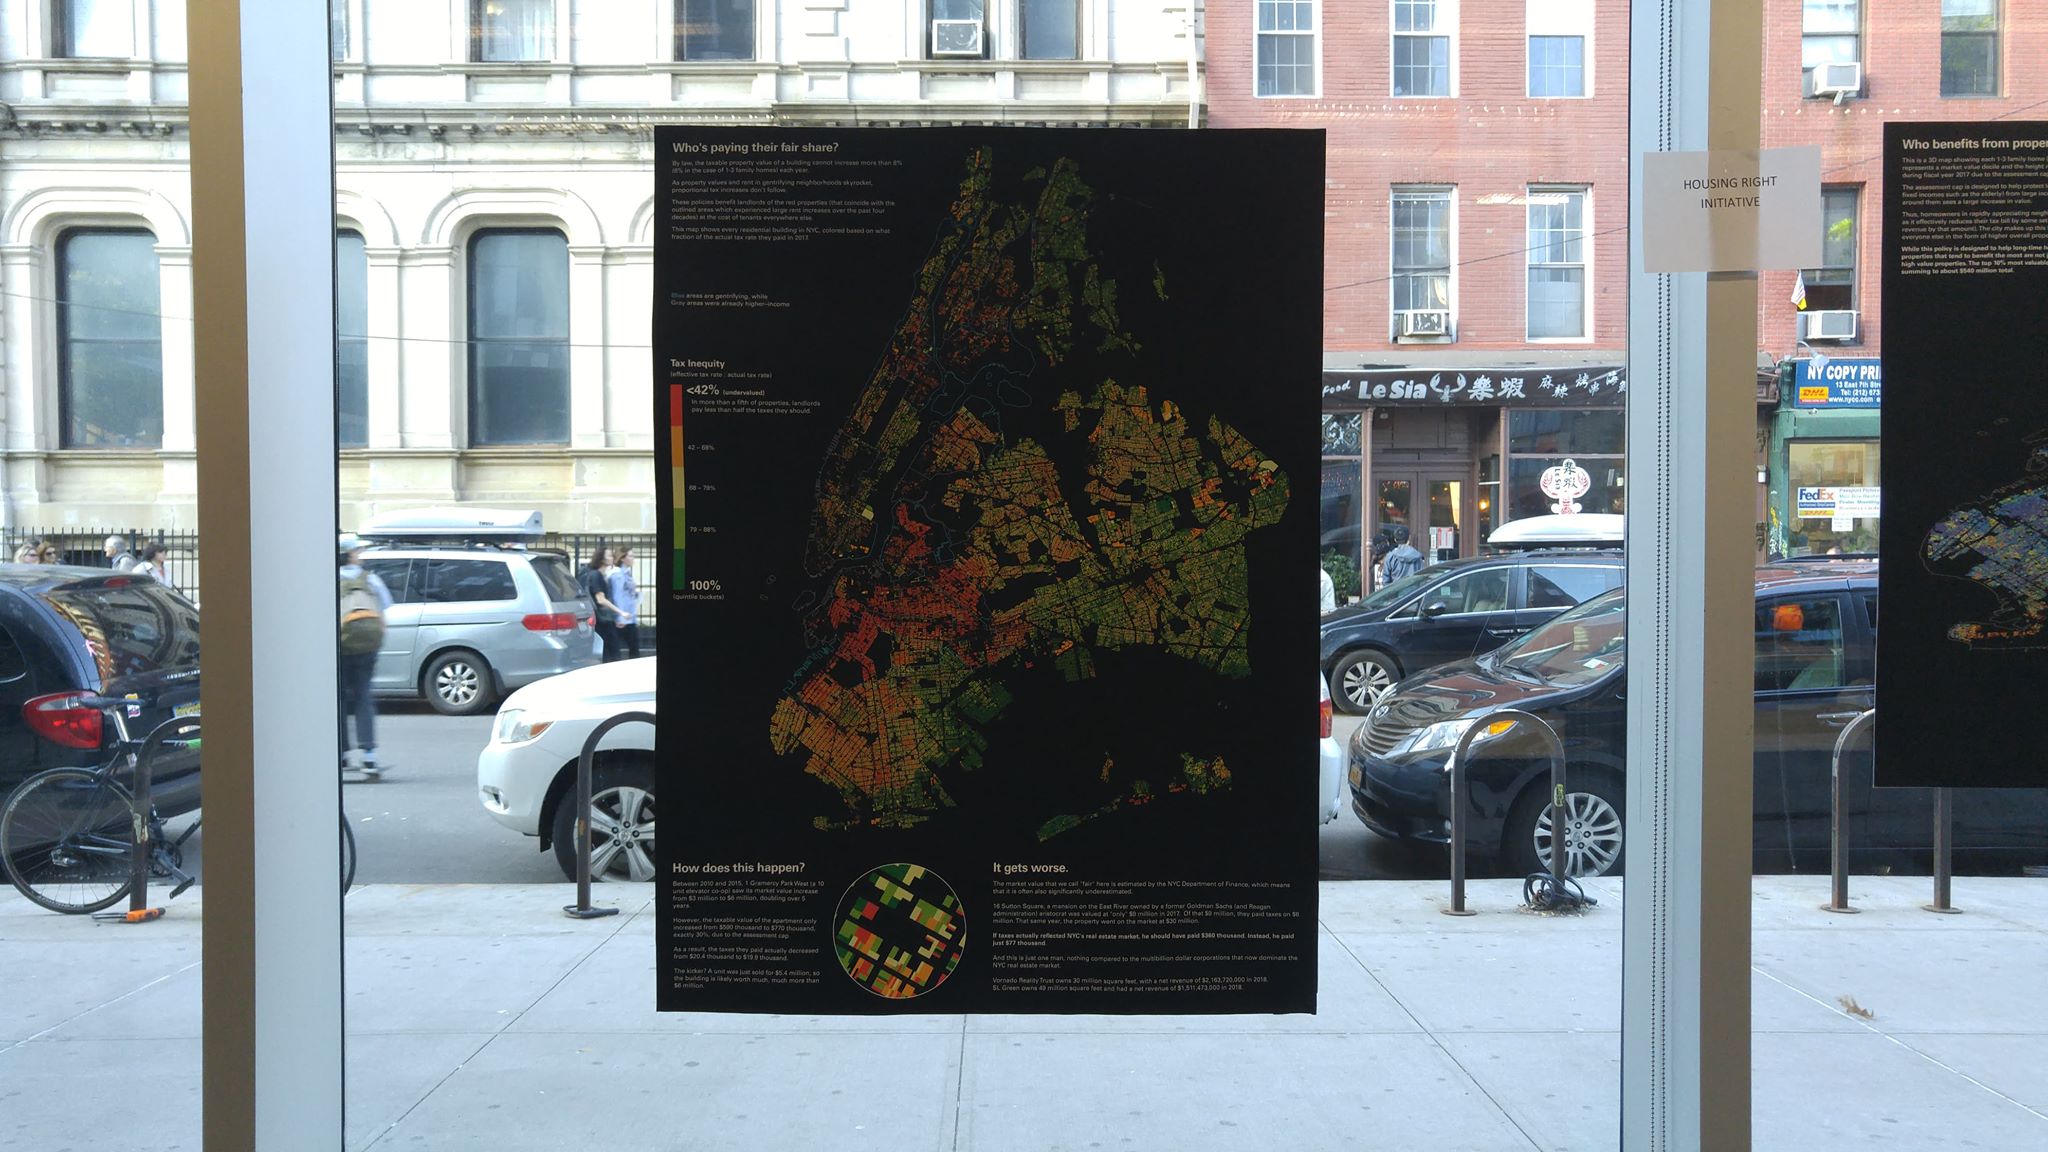
## Housing Rights Intiative
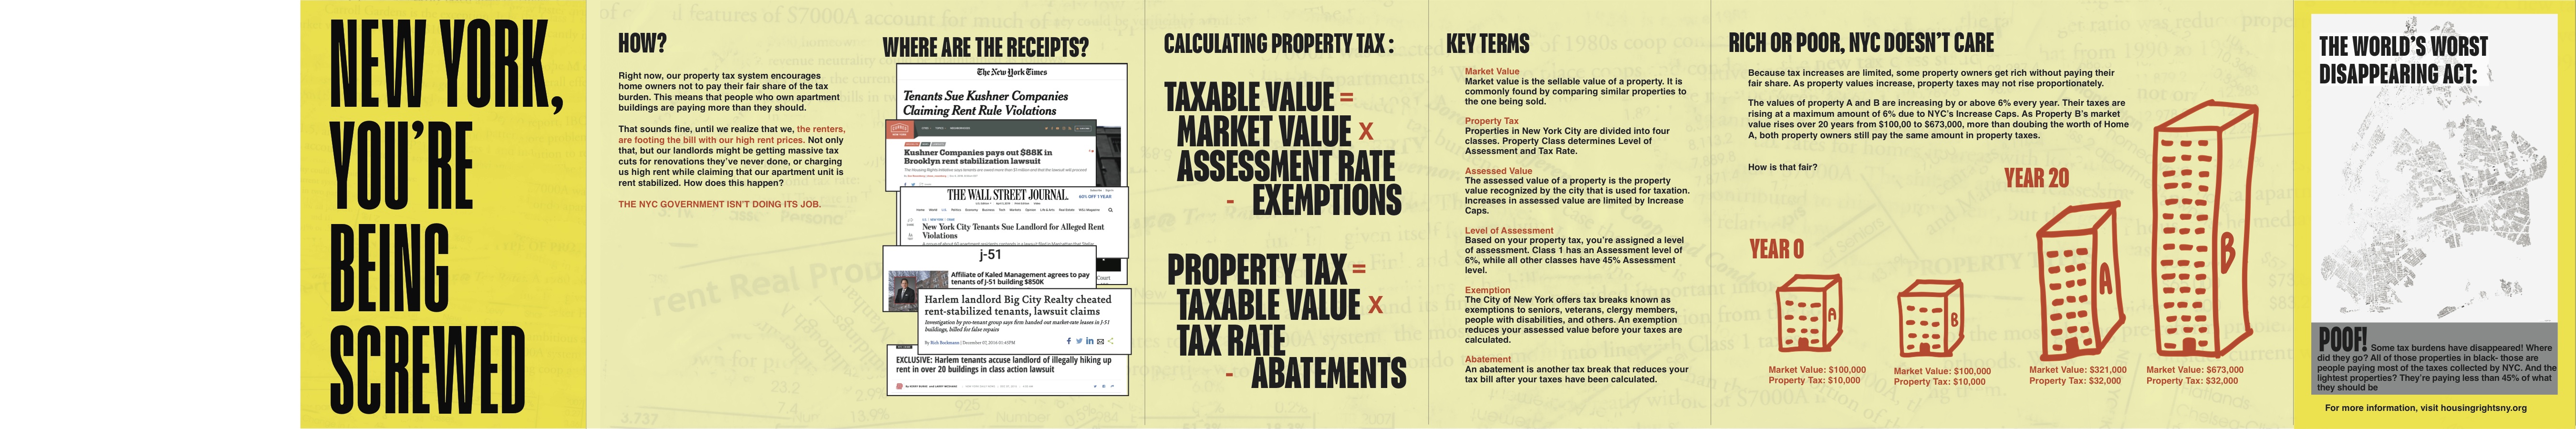
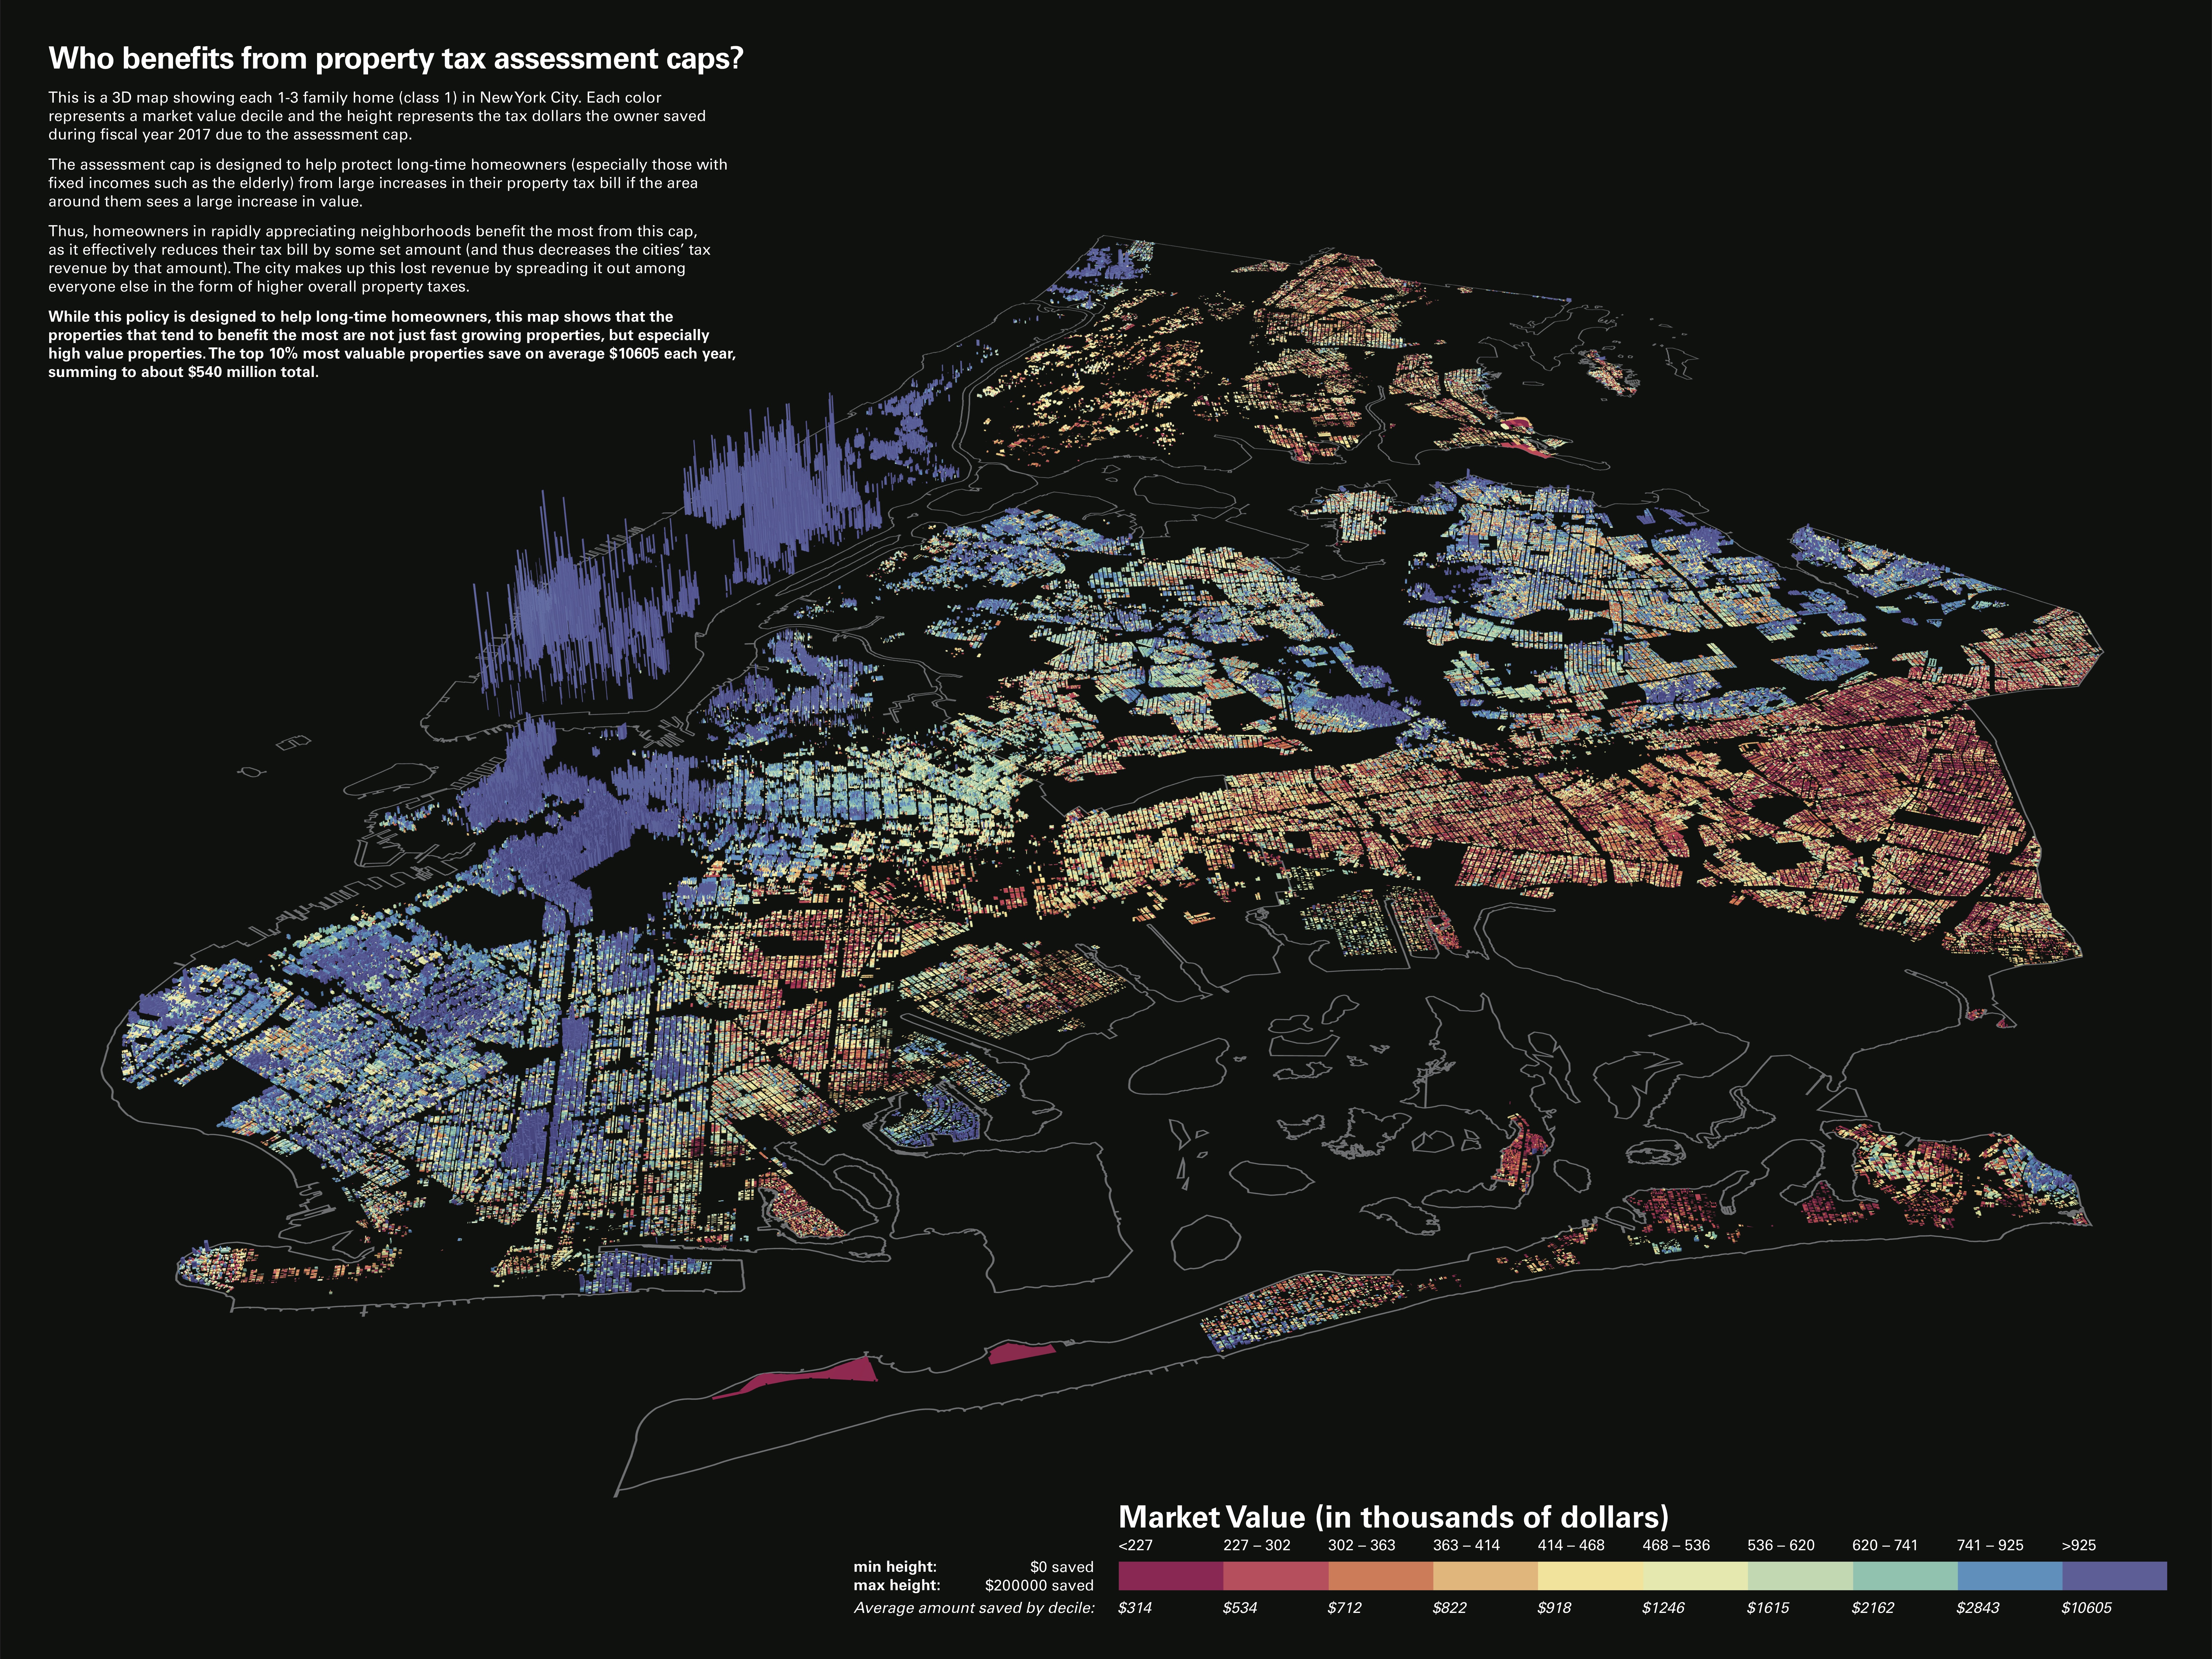
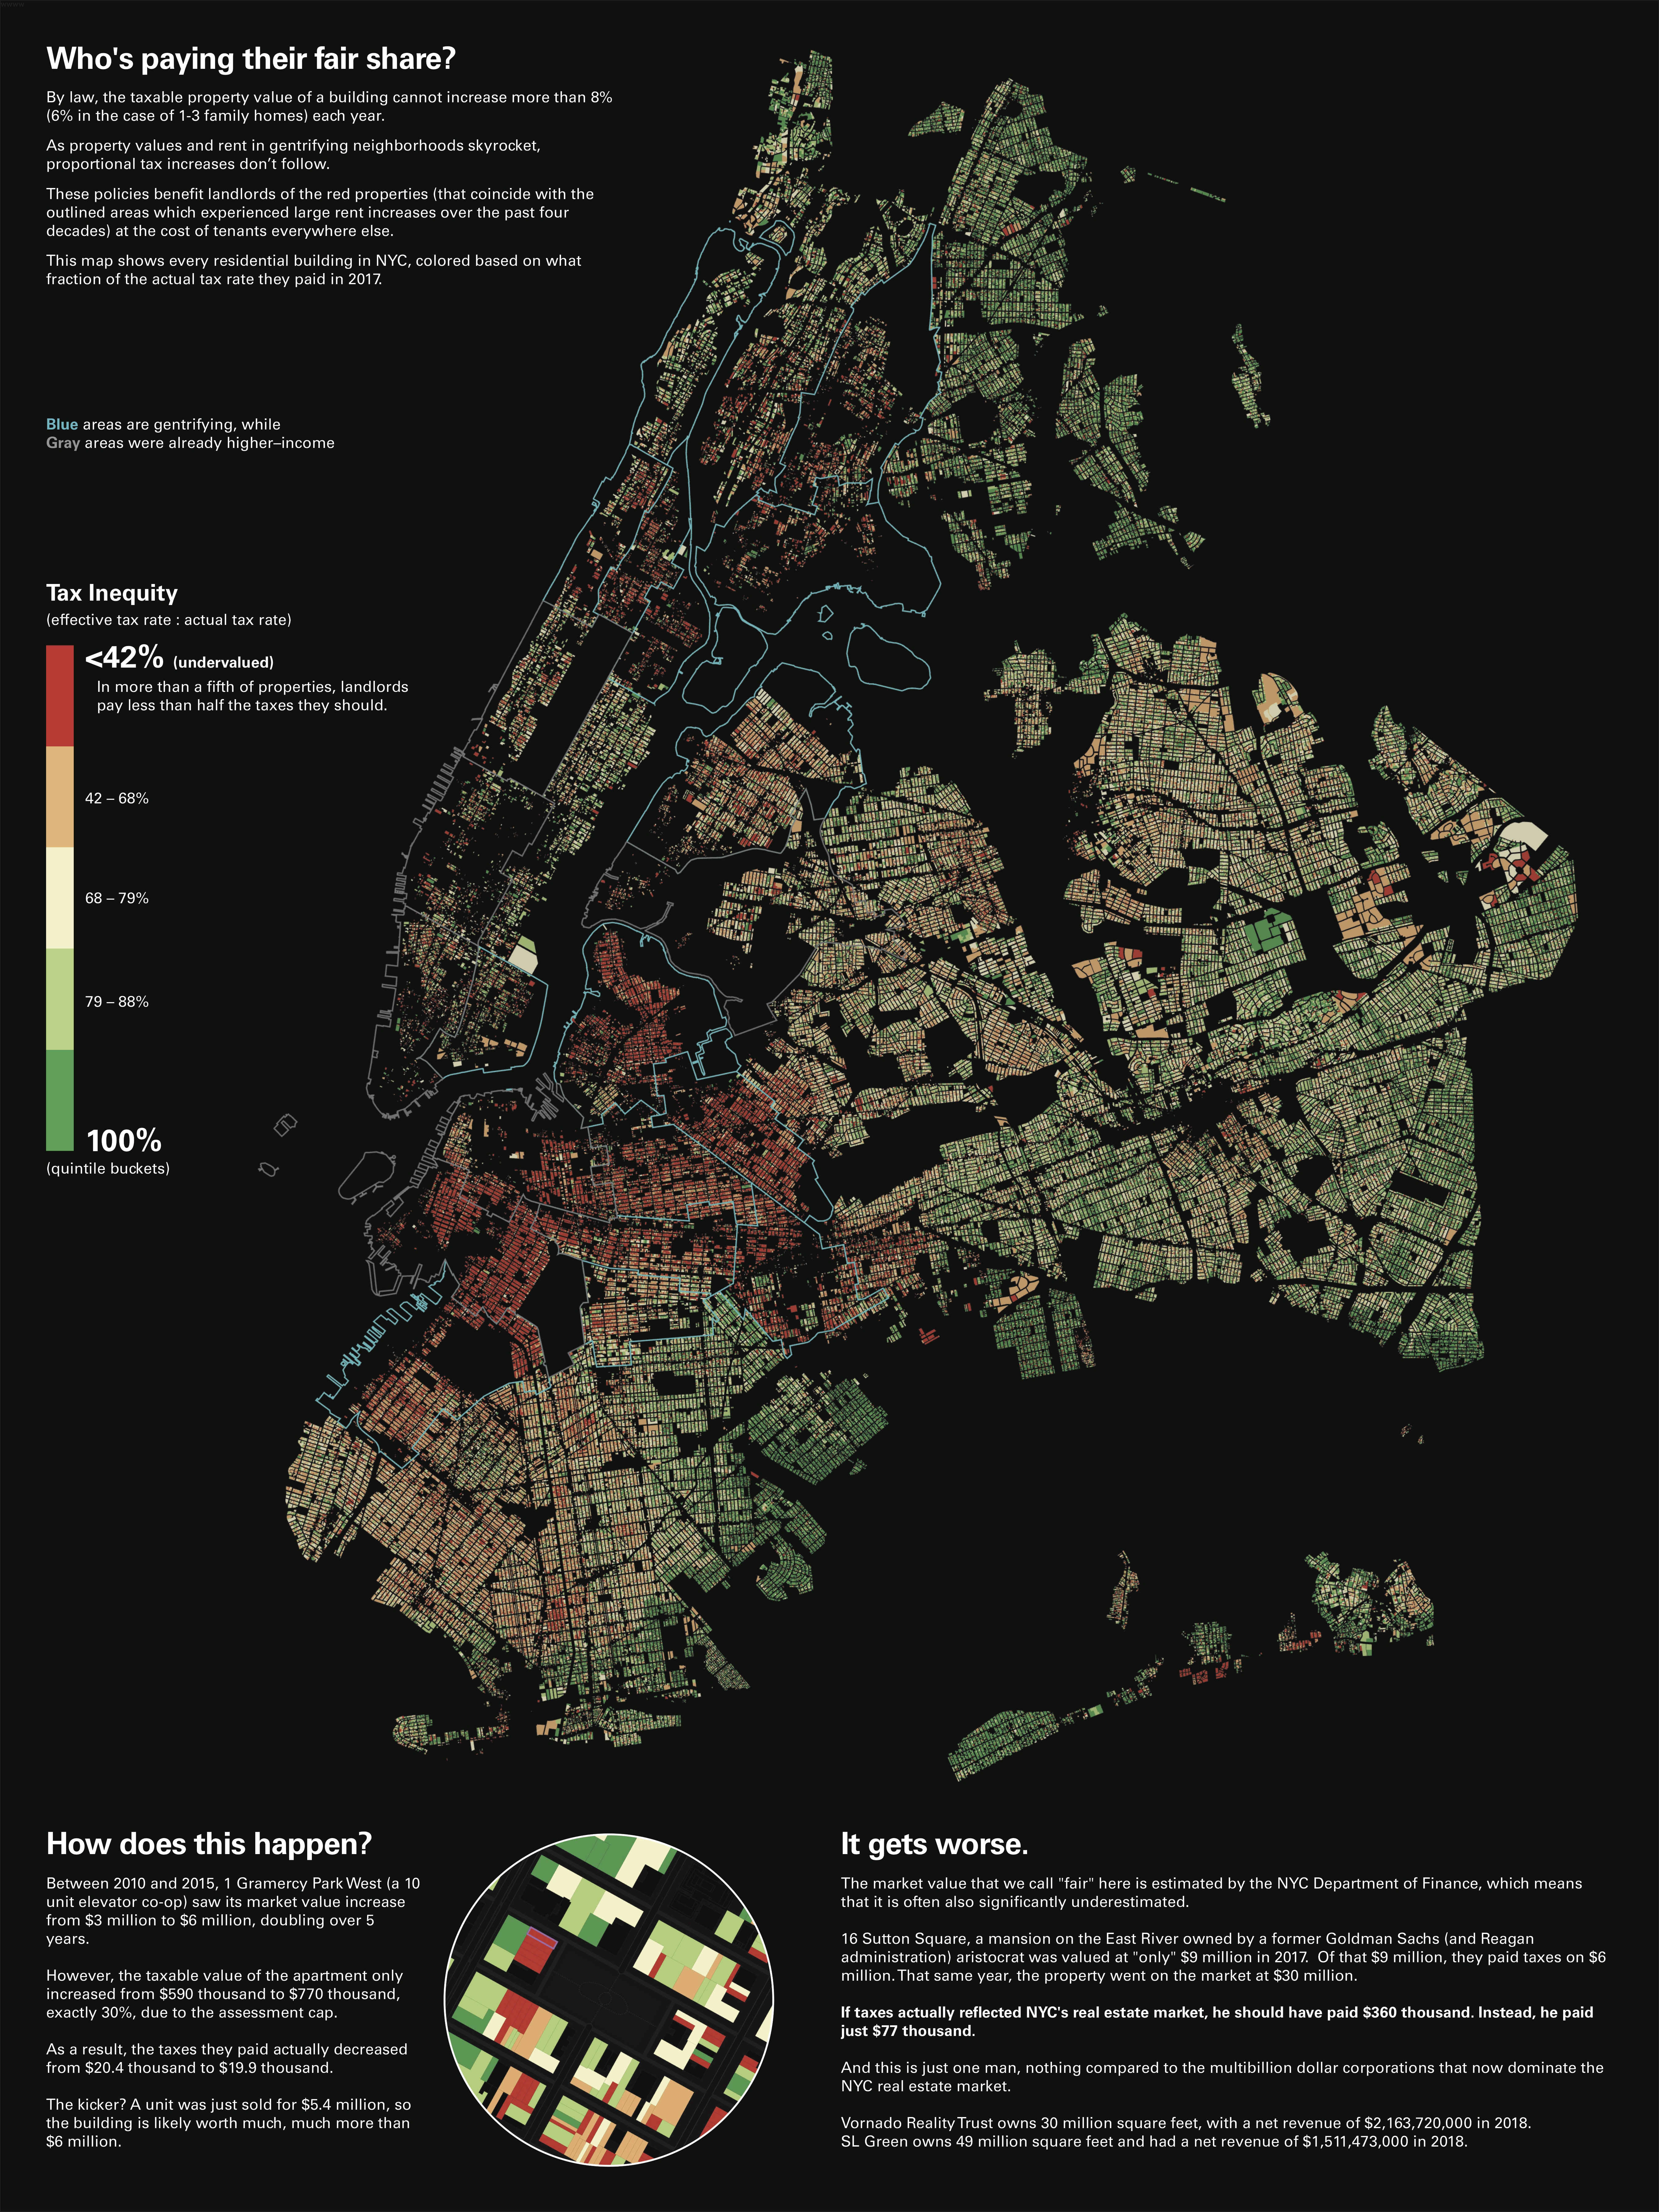
[Housing Rights Intiative](https://housingrightsny.org/) is a non-profit watchdog group that uses a data driven approach to investigate real estate fraud and connect tenants to legal support. We worked with HRI on a realted problem, specifically the inequtiy introduced by the caps place on property taxes in New York City. The students produced one short 'foldable' handout that quickly and easily explains how tax laws can create inequity over time, and two large maps of New York City illustrating the areas affected, and how severe the inequity is.
Here are links to the full-resolution [foldable]({{site.url}}/~keene/images/dataSci2019/Foldable.pdf), [map 1]({{site.url}}/~keene/images/dataSci2019/3d_FINAL.pdf) and [map 2]({{site.url}}/~keene/images/dataSci2019/map_ext_FINAL.pdf).
Students: Calil Russell-Arguedas, Nicholas Gao, Ryan Jaipersaud, Kevin Sheng, Camila Villa Zertuche
## City Harvest
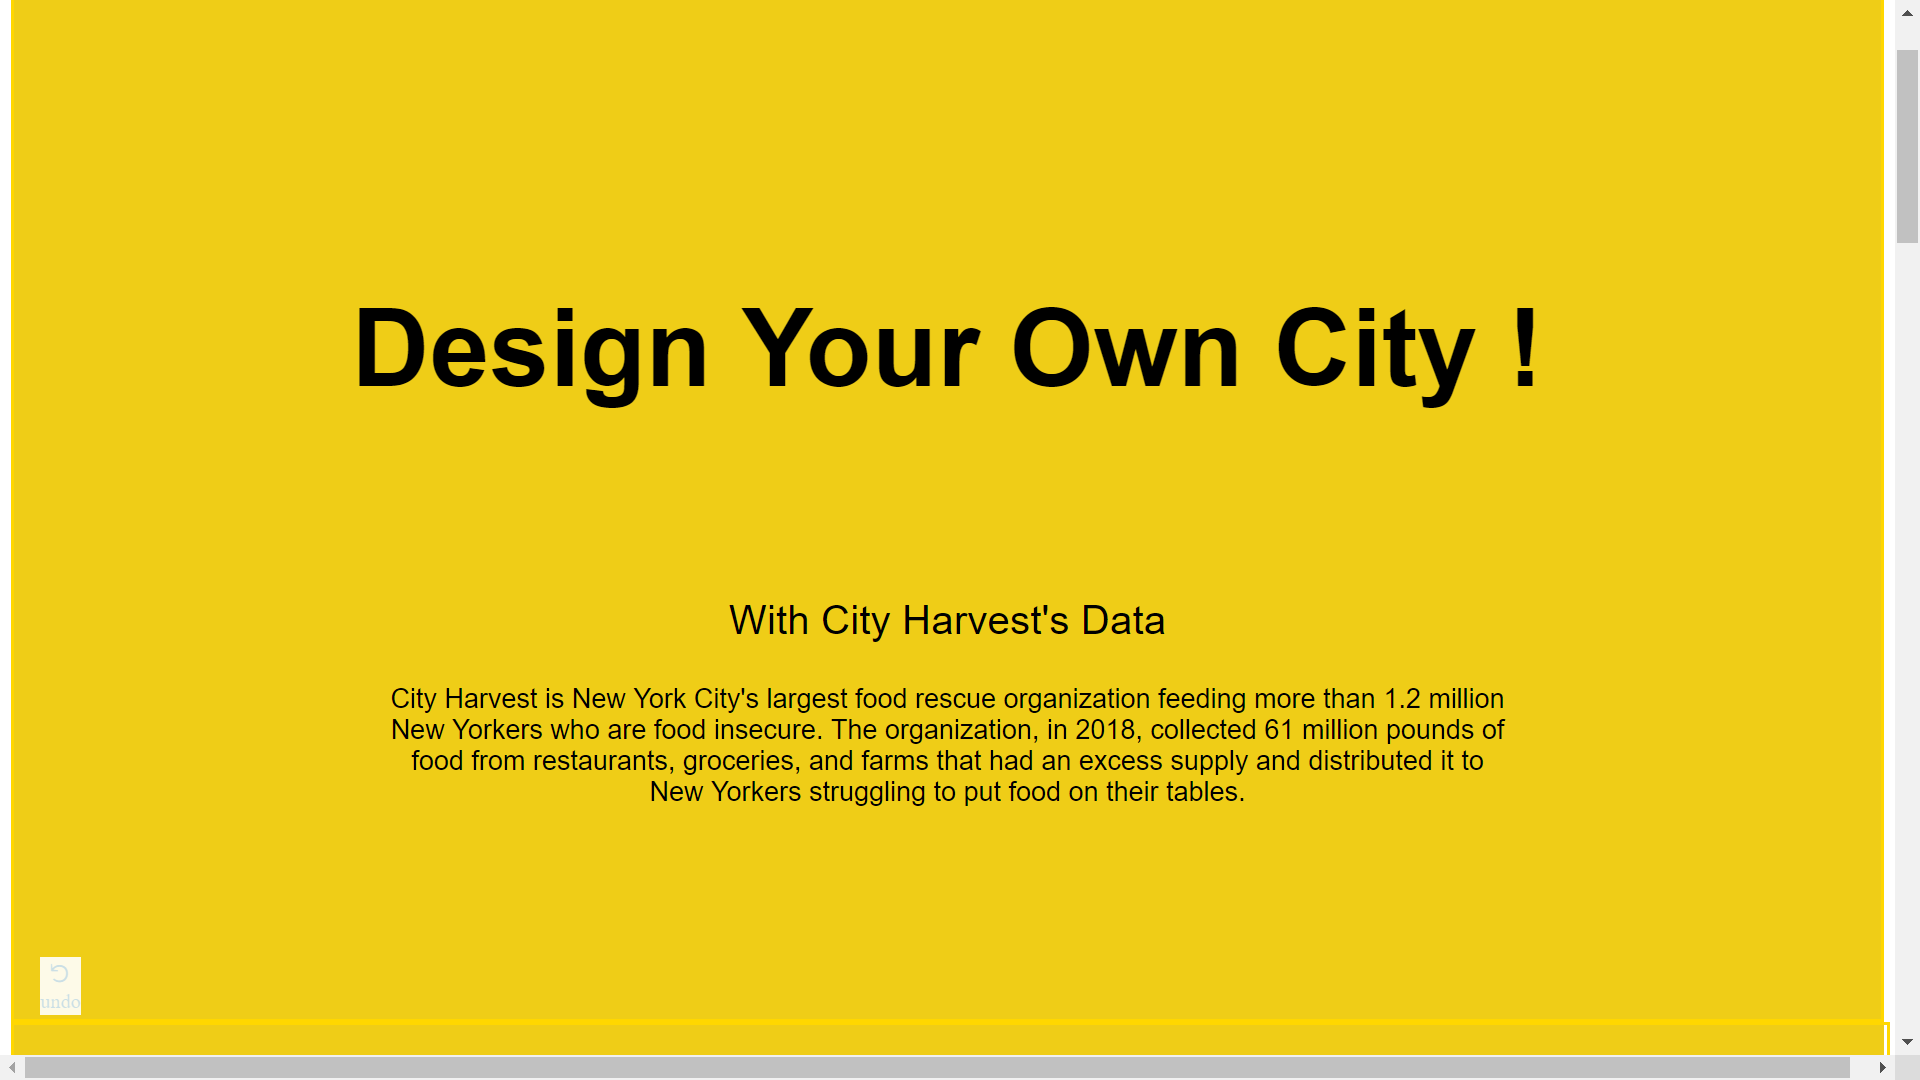
[City Harvest](https://www.cityharvest.org/) is a non-profit dedicated to eliminating food insecurity in New York City. We worked on two projects with them this semester. The first project used a dataset of the locations of every food pantry, soup kitchen, etc, in New York City. This dataset included how many meals were served on a monthly basis, and indicated how many were served to single people, families, seniors, etc.
The students used this data in several ways. First, produced a [website](https://nycity-meals.glitch.me/) that shows the changing patterns of food insecurity.
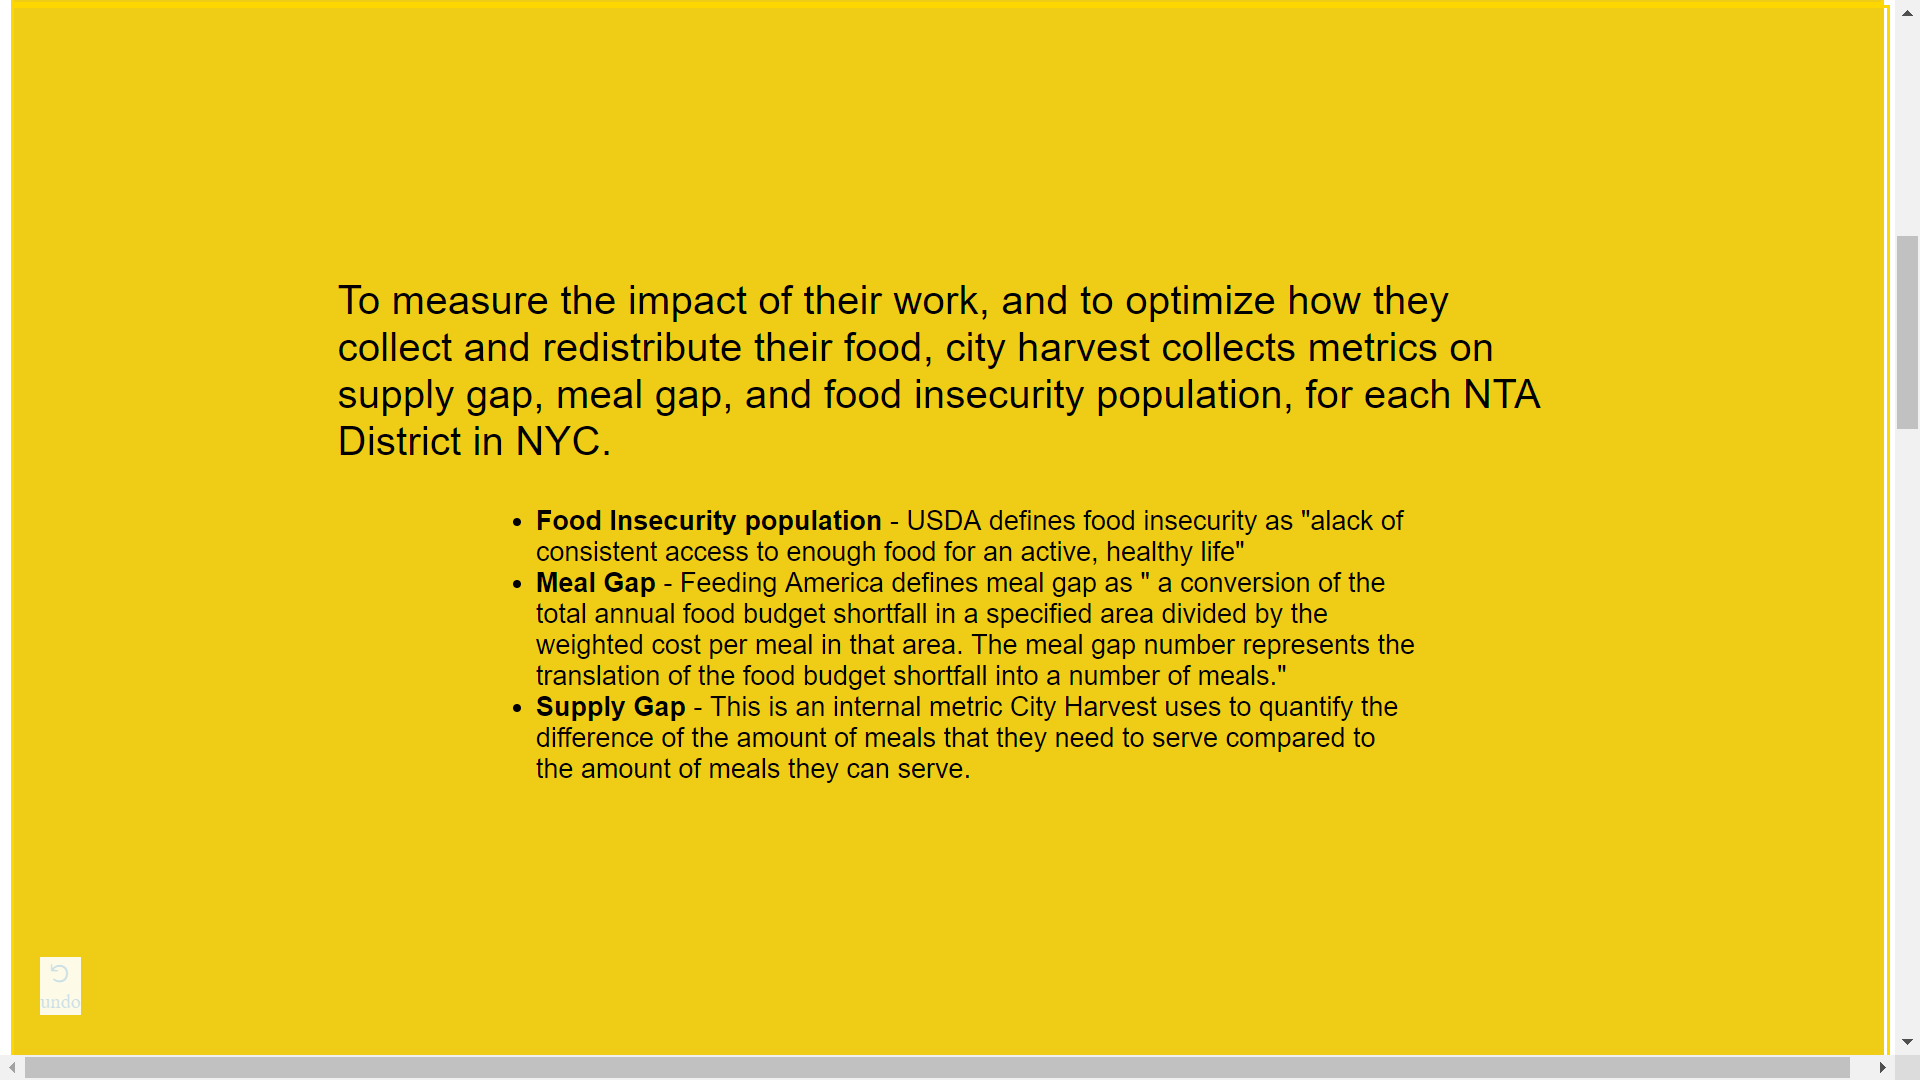
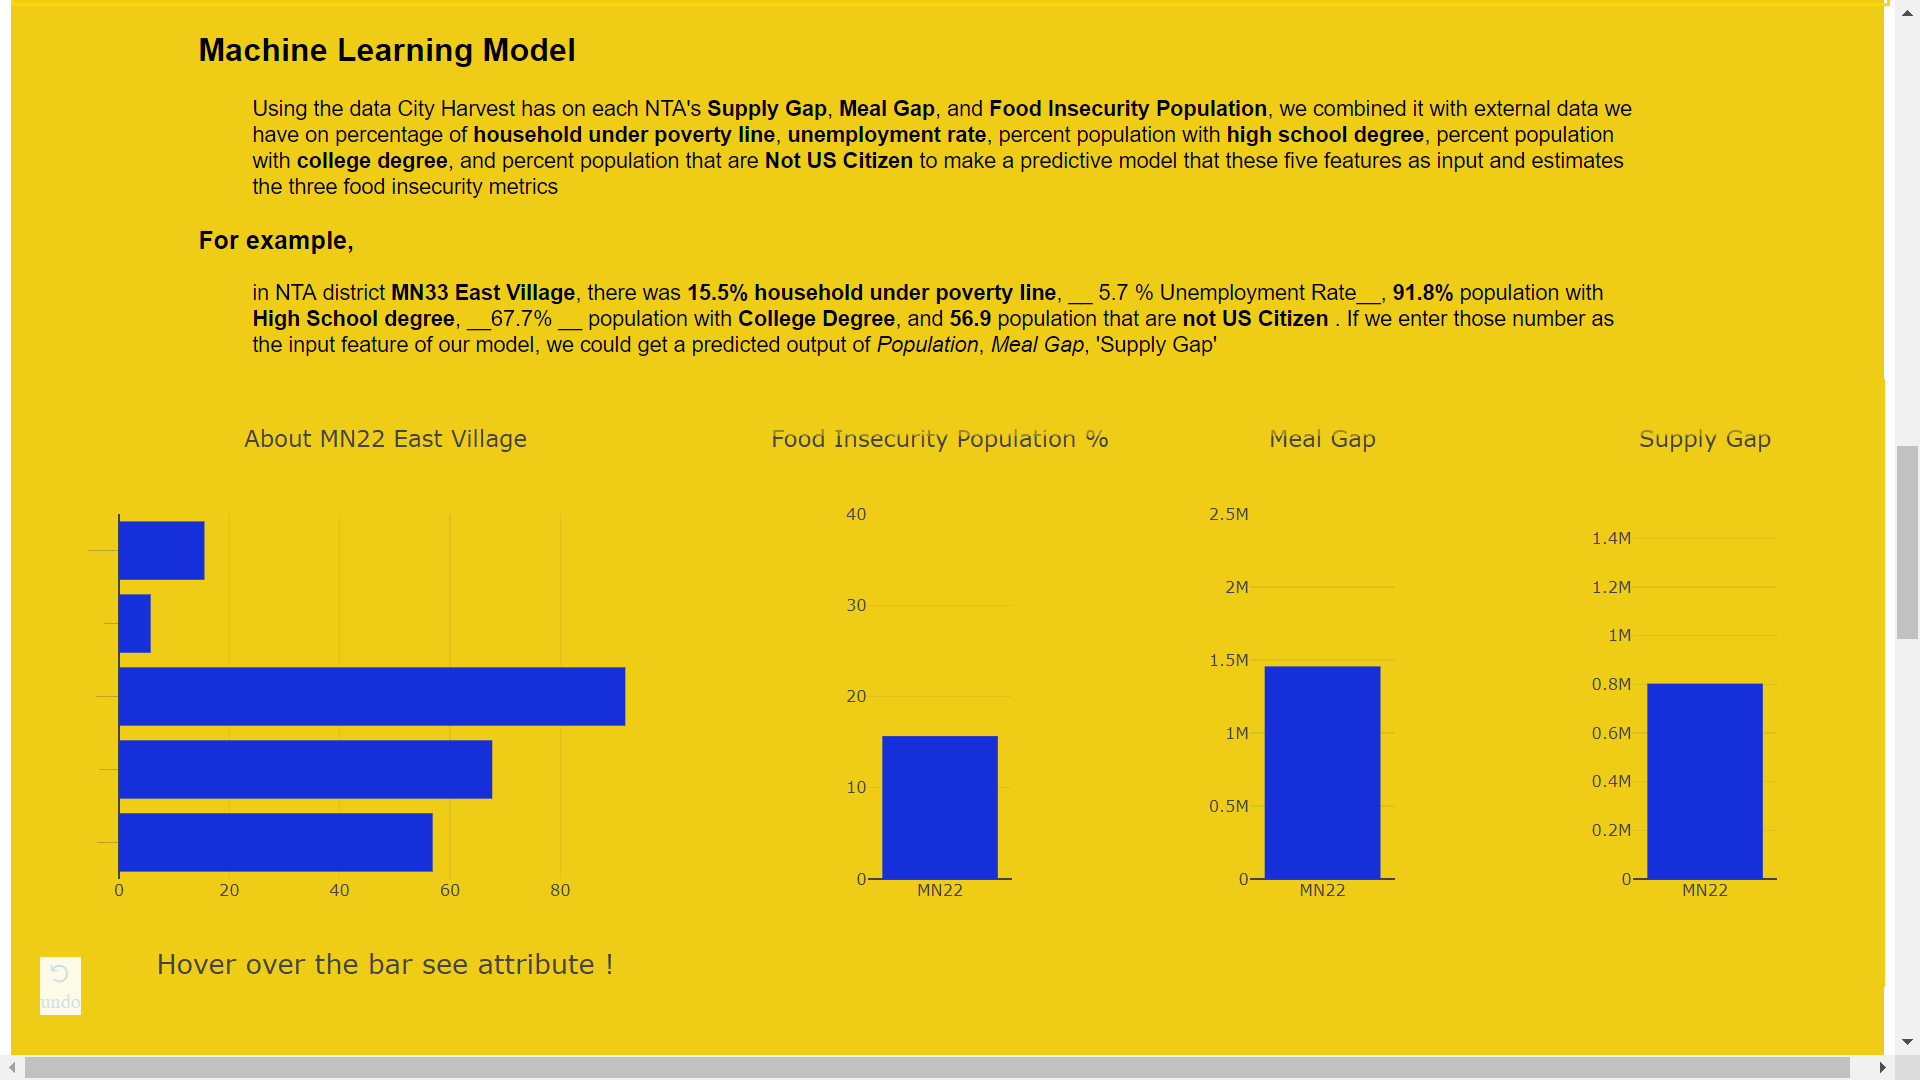
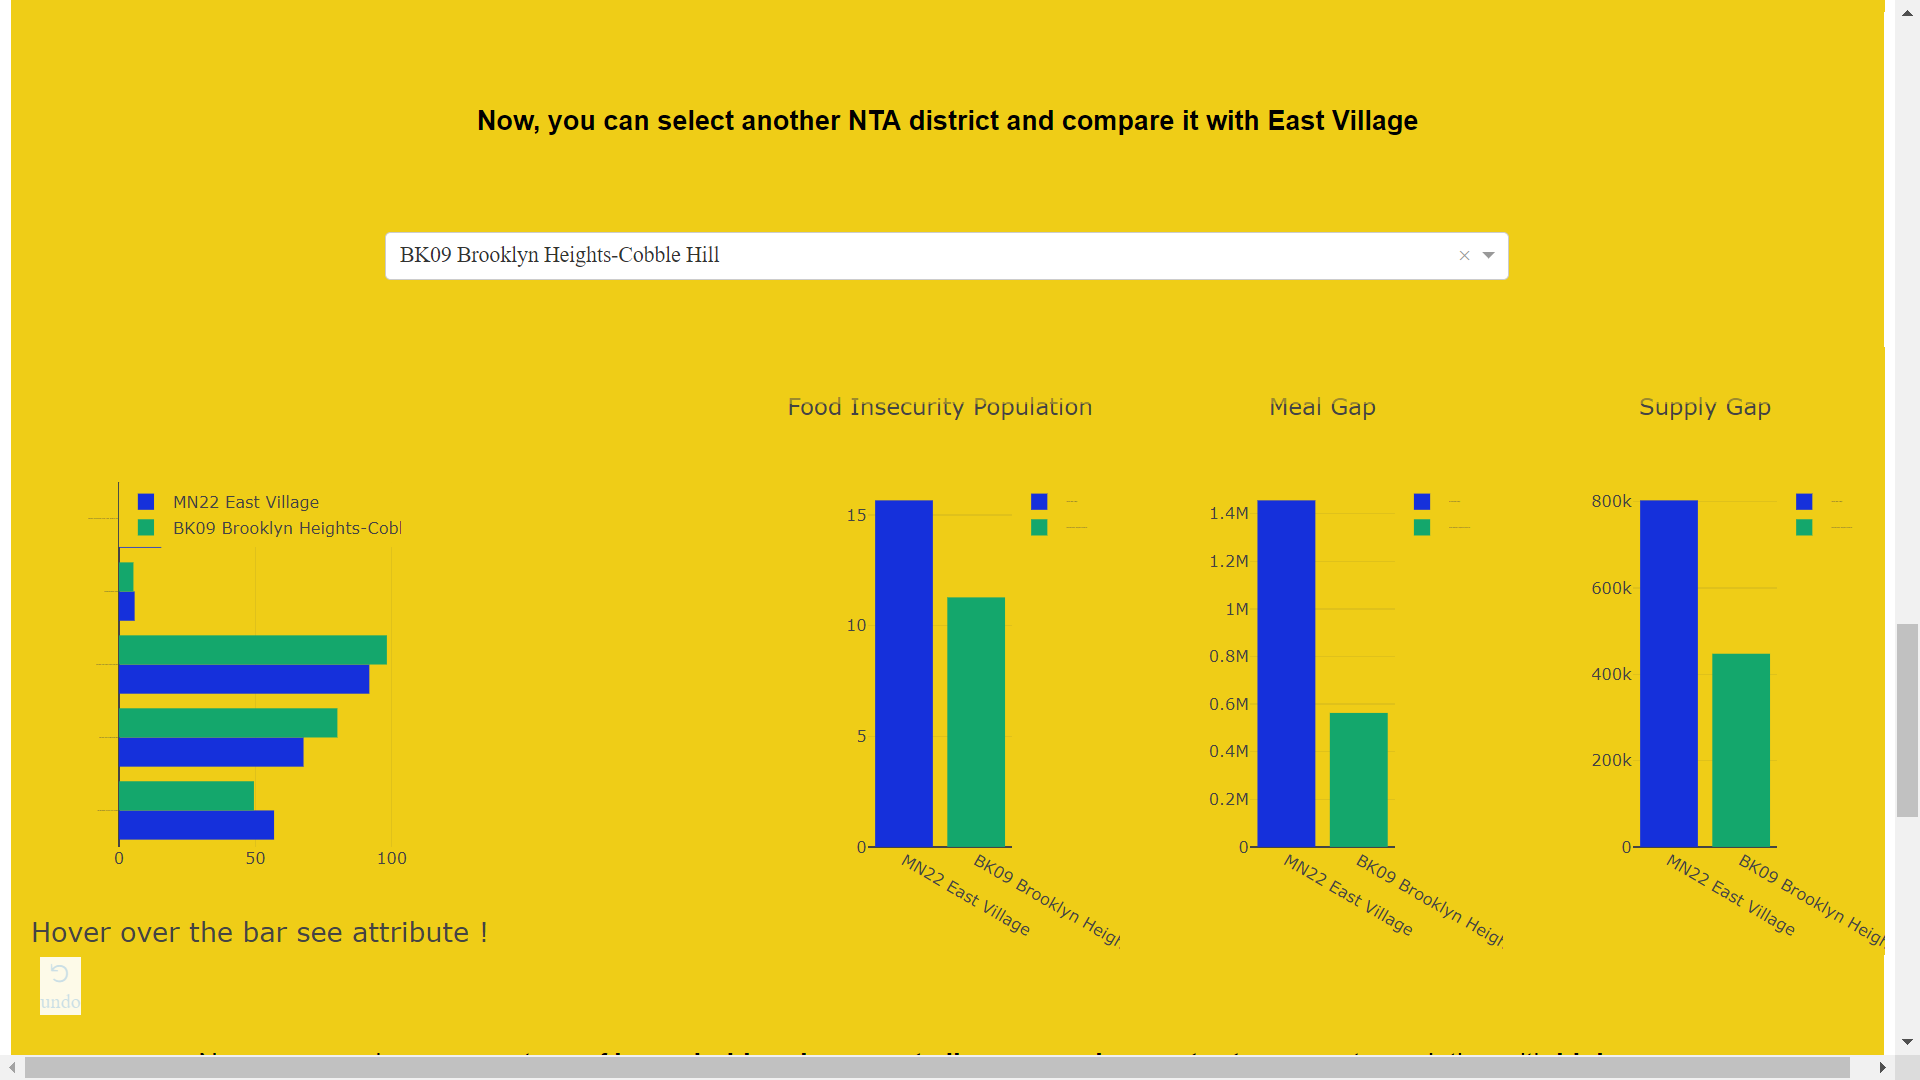
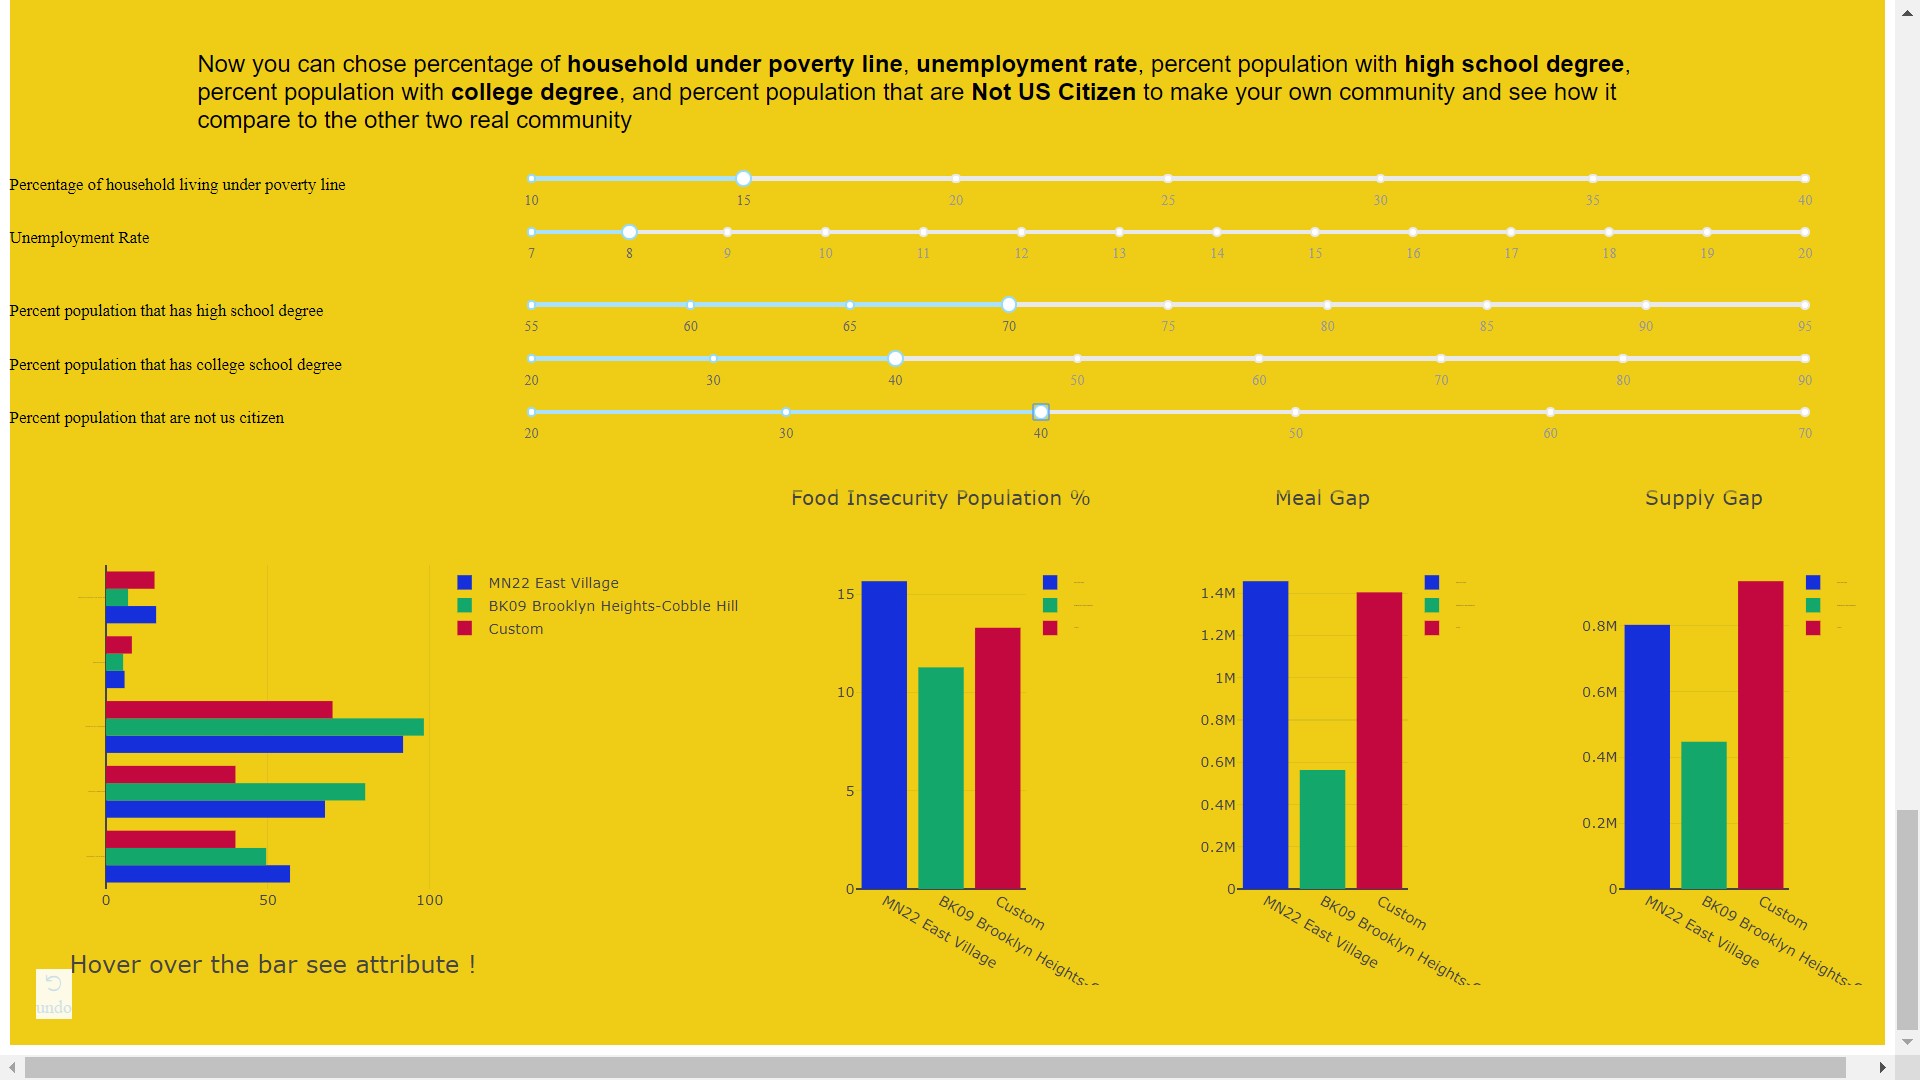
Second, they created an interactive tool that uses machine learning to predict the meal gap in a given neighborhood. They exposed the most predictive features of food insecurity, such as unemployment rate, percentage of people with a college degree, average household income, etc. The tool allows a user to adjust these predictors and see what the food insecurity level of hypothetical neighborhood might be. Some screenshots of this tool are below, we hope to have it hosted online soon so that anyone can experiment with it.
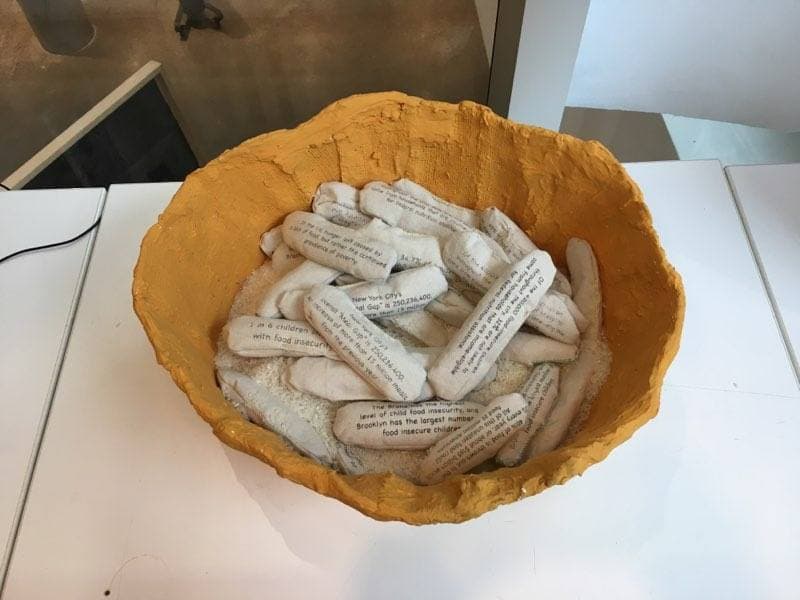
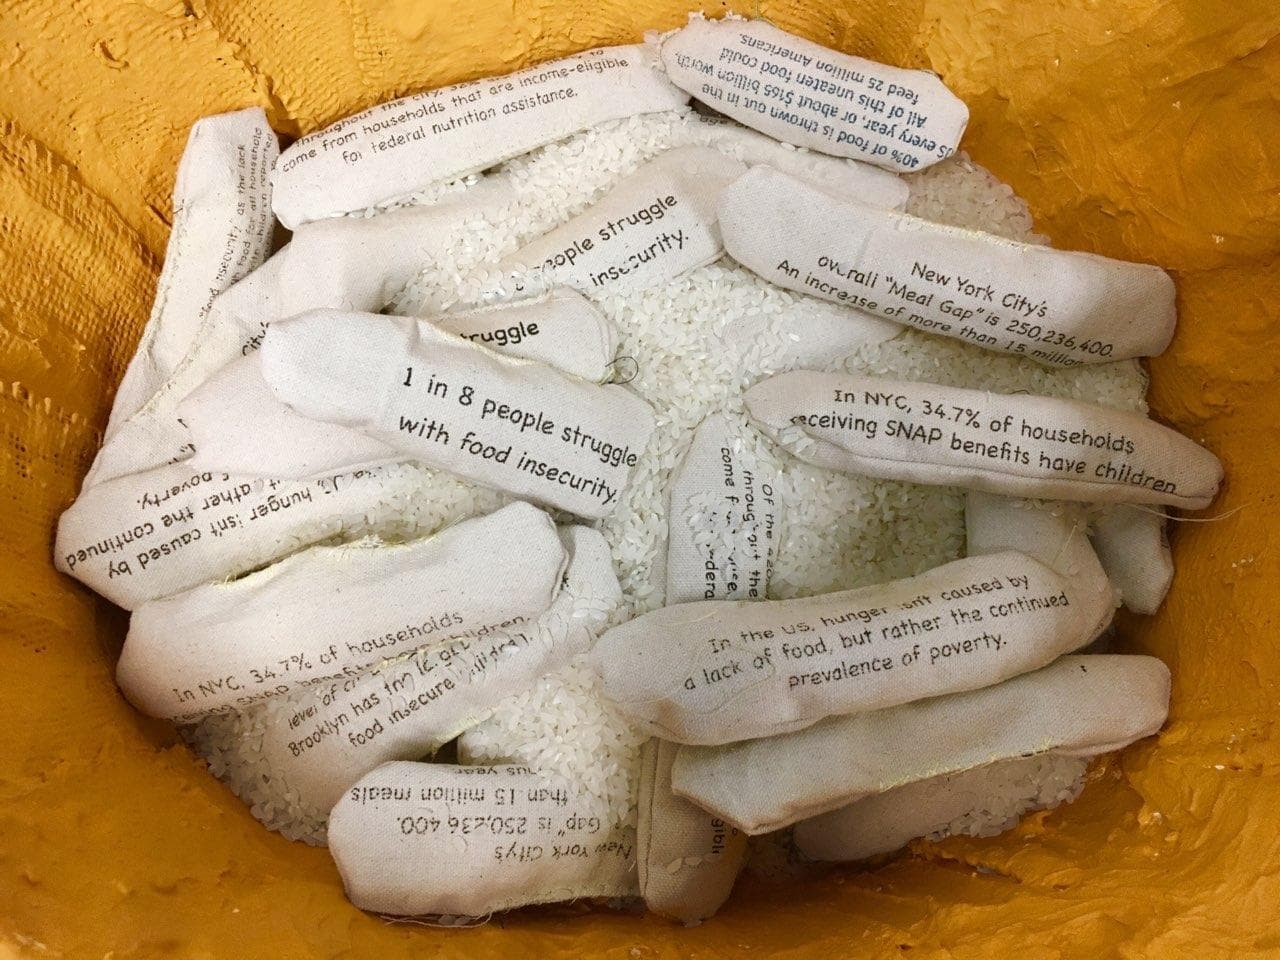
Finally, the data inspired a sculpture of a rice bowl. Inside this rice bowl are grains of rice, large and small, some inscribed with various facts about food insecurity in New York City.
The second group of students worked on an internal data visualization tool for City Harvest, but unfortunately, we are unable to share this outside the organization.
Students: Elvin Hu, Zheng Liu, Raymond Lee, Jessica Martinez, Michelle Lourduy Reyes, Nithi Subbaian, Zheng Liu, Stanley Zheng,
## Everytown for Gun Safety
Another group worked with [Everytown for Gun Safety](https://everytown.org/), a non-profit dedicated to ending gun violence and building safer communities. We worked specifically on a dataset they shared with us titled [#NotAnAccident](https://everytownresearch.org/notanaccident/). This dataset attempt tracks all times a gun was discharged accidentally by a minor(17 years an under).
The students did two projects related to this dataset. The first was an interactive lightbox that allowed the viewer to overlay different transparecies over a map of the United states, and to compare different statistics in different states. A picture of all the overlays is below, and the individuals can be found [here]({{site.url}}/~keene/images/dataSci2019/everytownMaps.pdf)

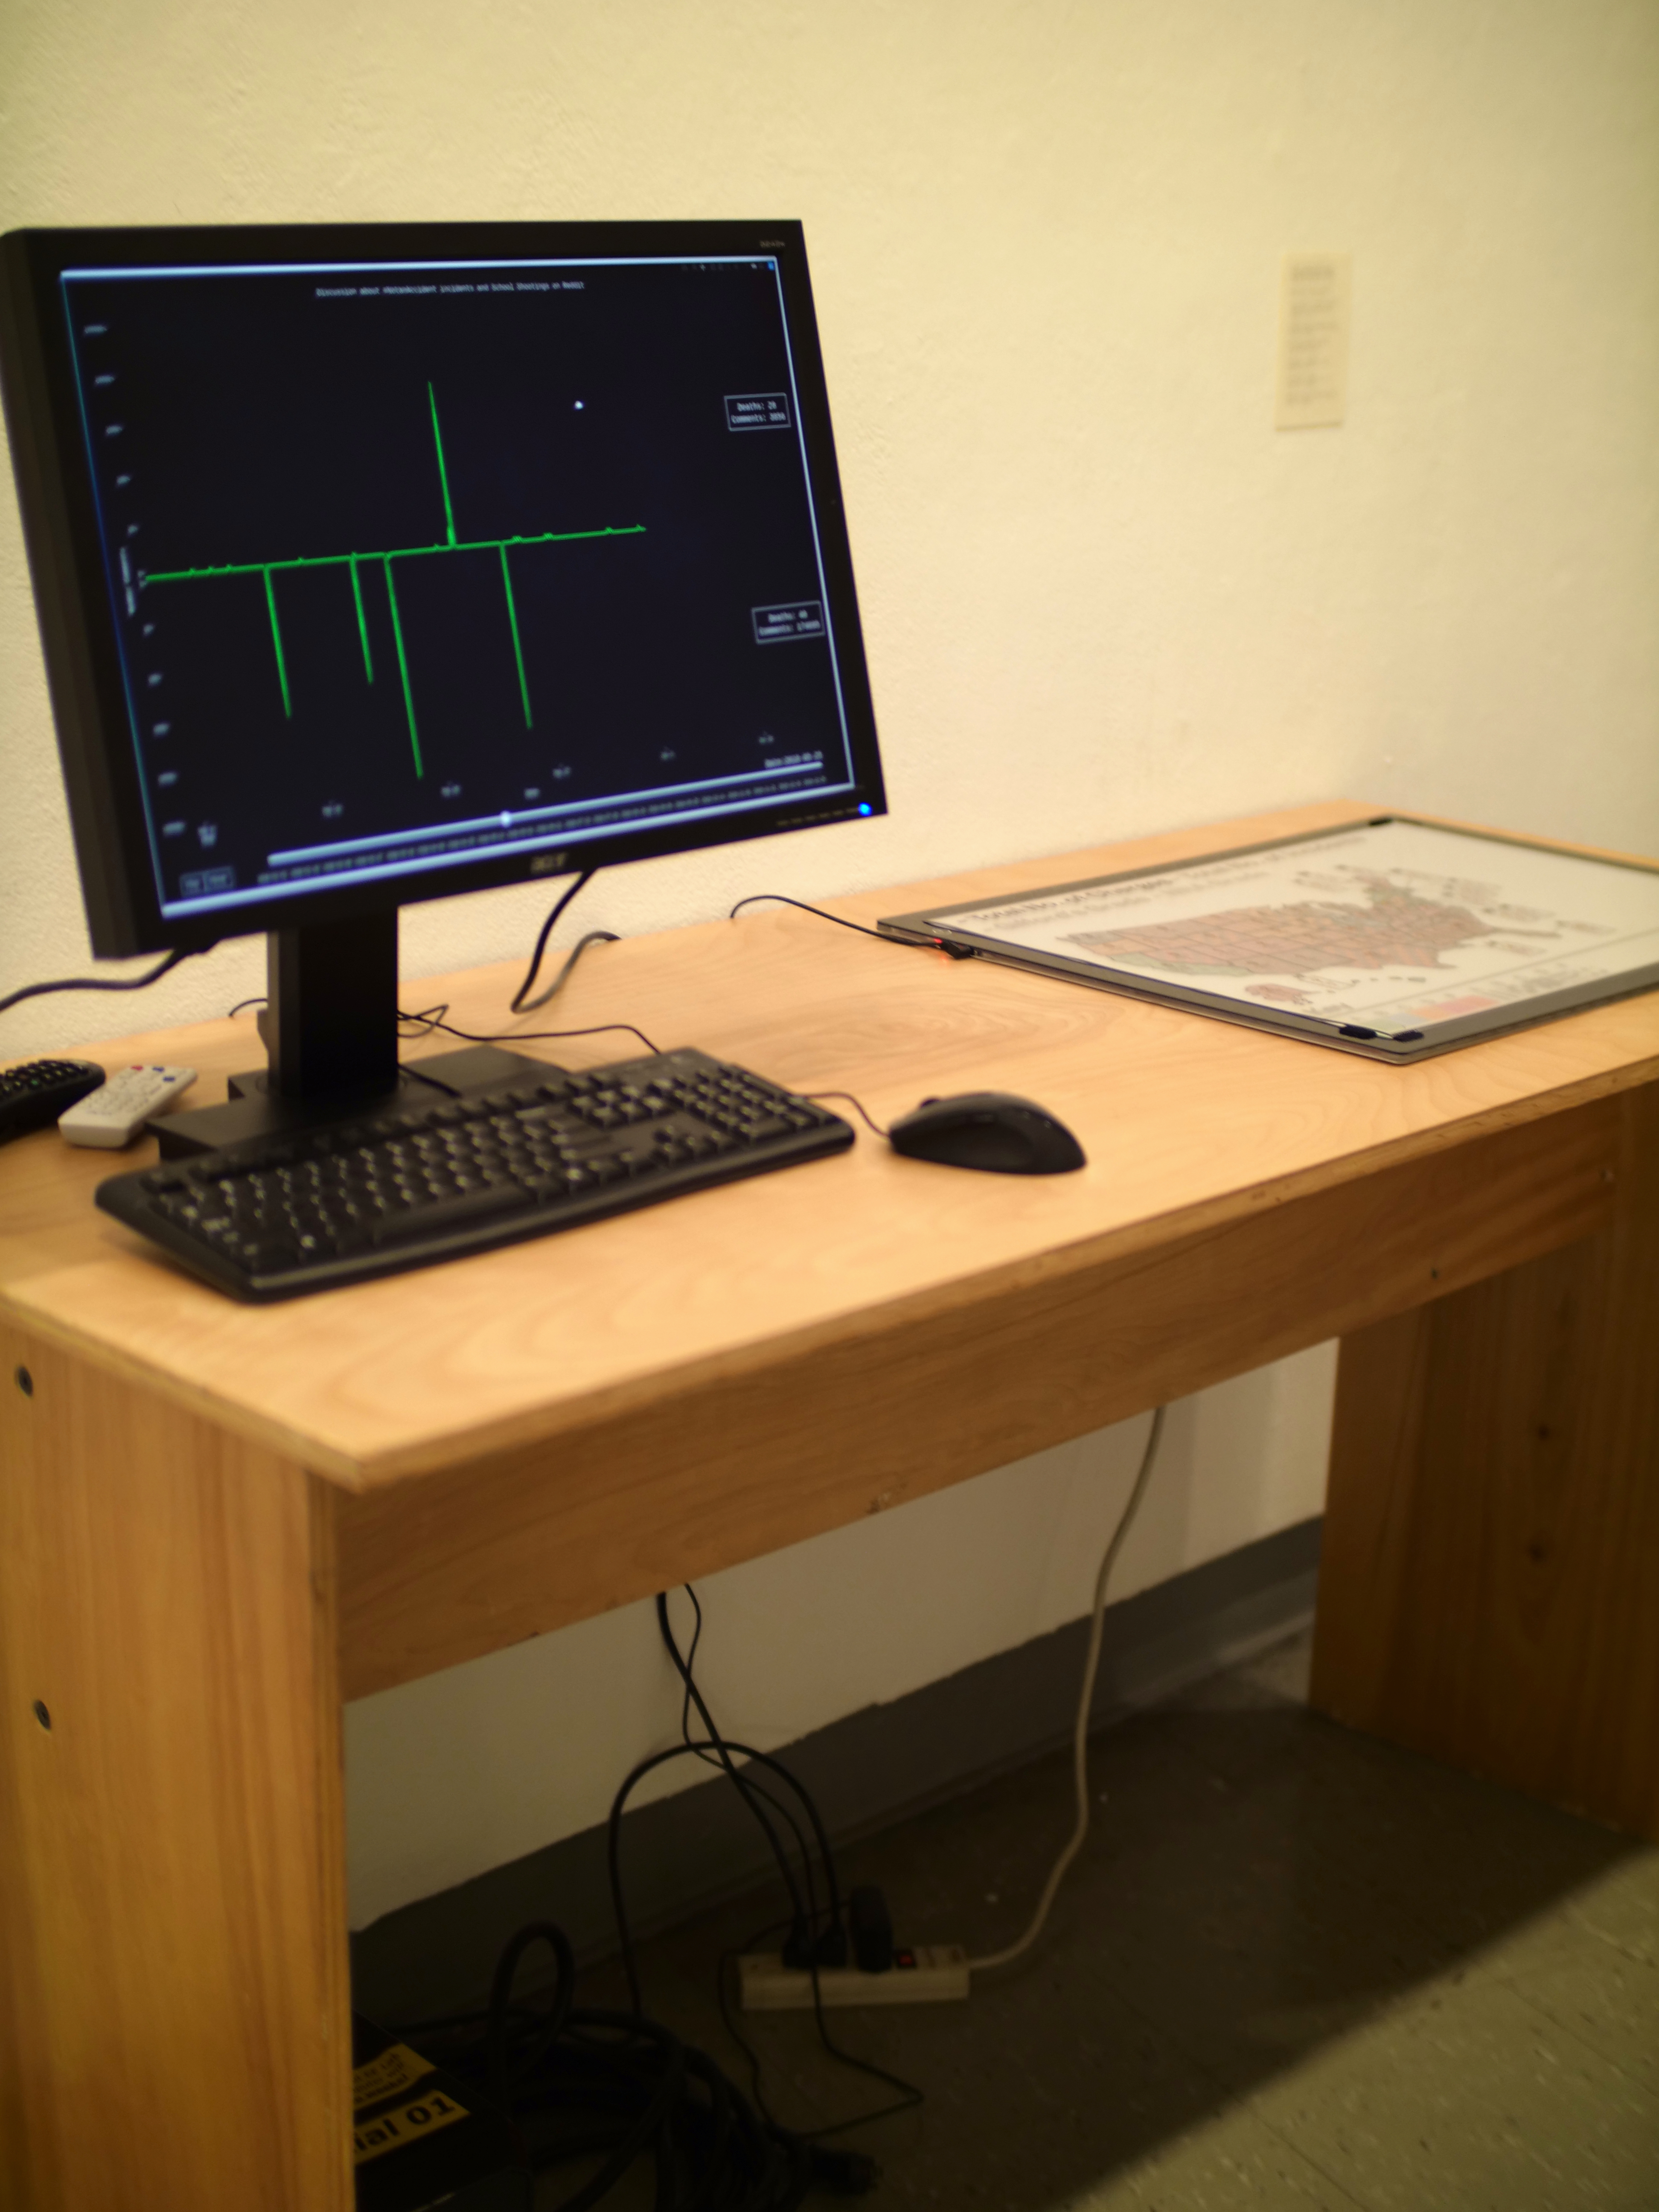
Additionally, this group worked with an open-source dataset of [Reddit](https://www.reddit.com/) comments. We were curious if people commented differently about #NotAnAccident gun incidents compared to school shootings. Specifically the students noticed that although #NotAnAccident incidents happened more often, with more victims, the online commentary was heavily skewed towards discussing school shooting incidents.
The students created an interactive, time driven visualzation of this, a screenshot of which is below. If you want to interact with the visulization, click [here]({{site.url}}/~keene/images/dataSci2019/Viz 1 Animation.html), just please give it a moment to load.

Students: Joseph Bentivegna, Zoe Bowhay, Jacob Maarek, Kavya Udupa
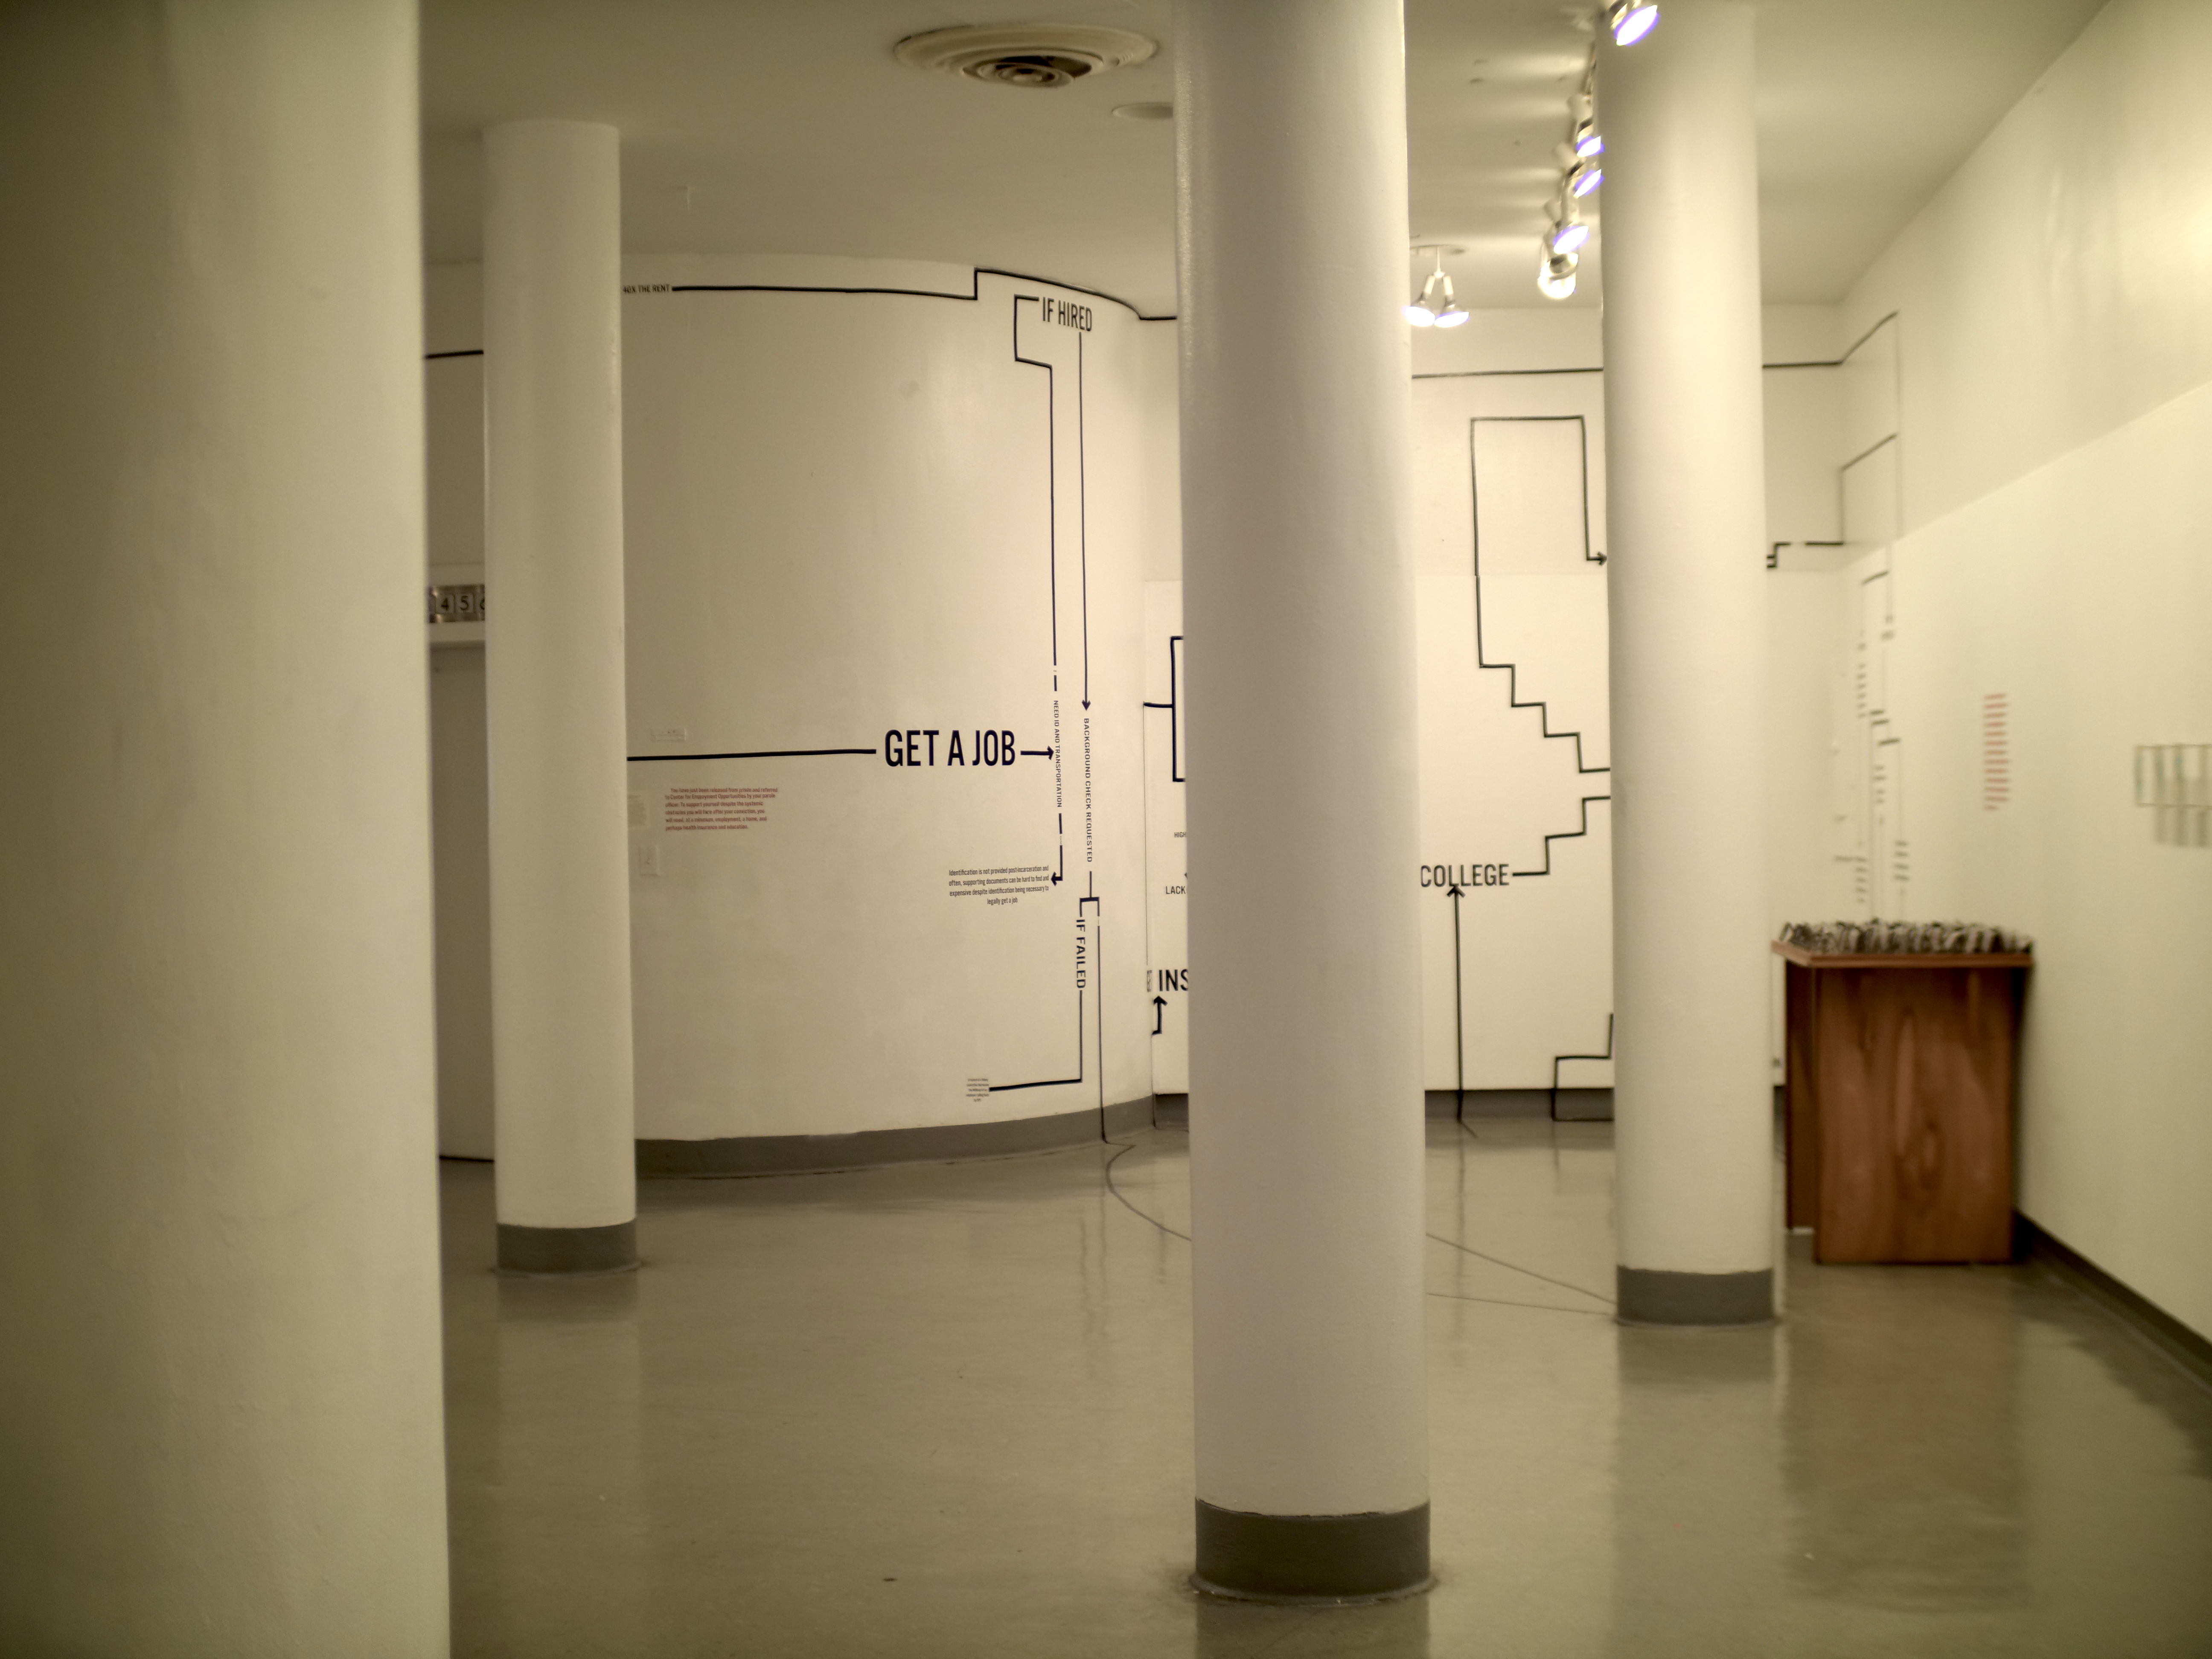
## Center for Employment Opportunities
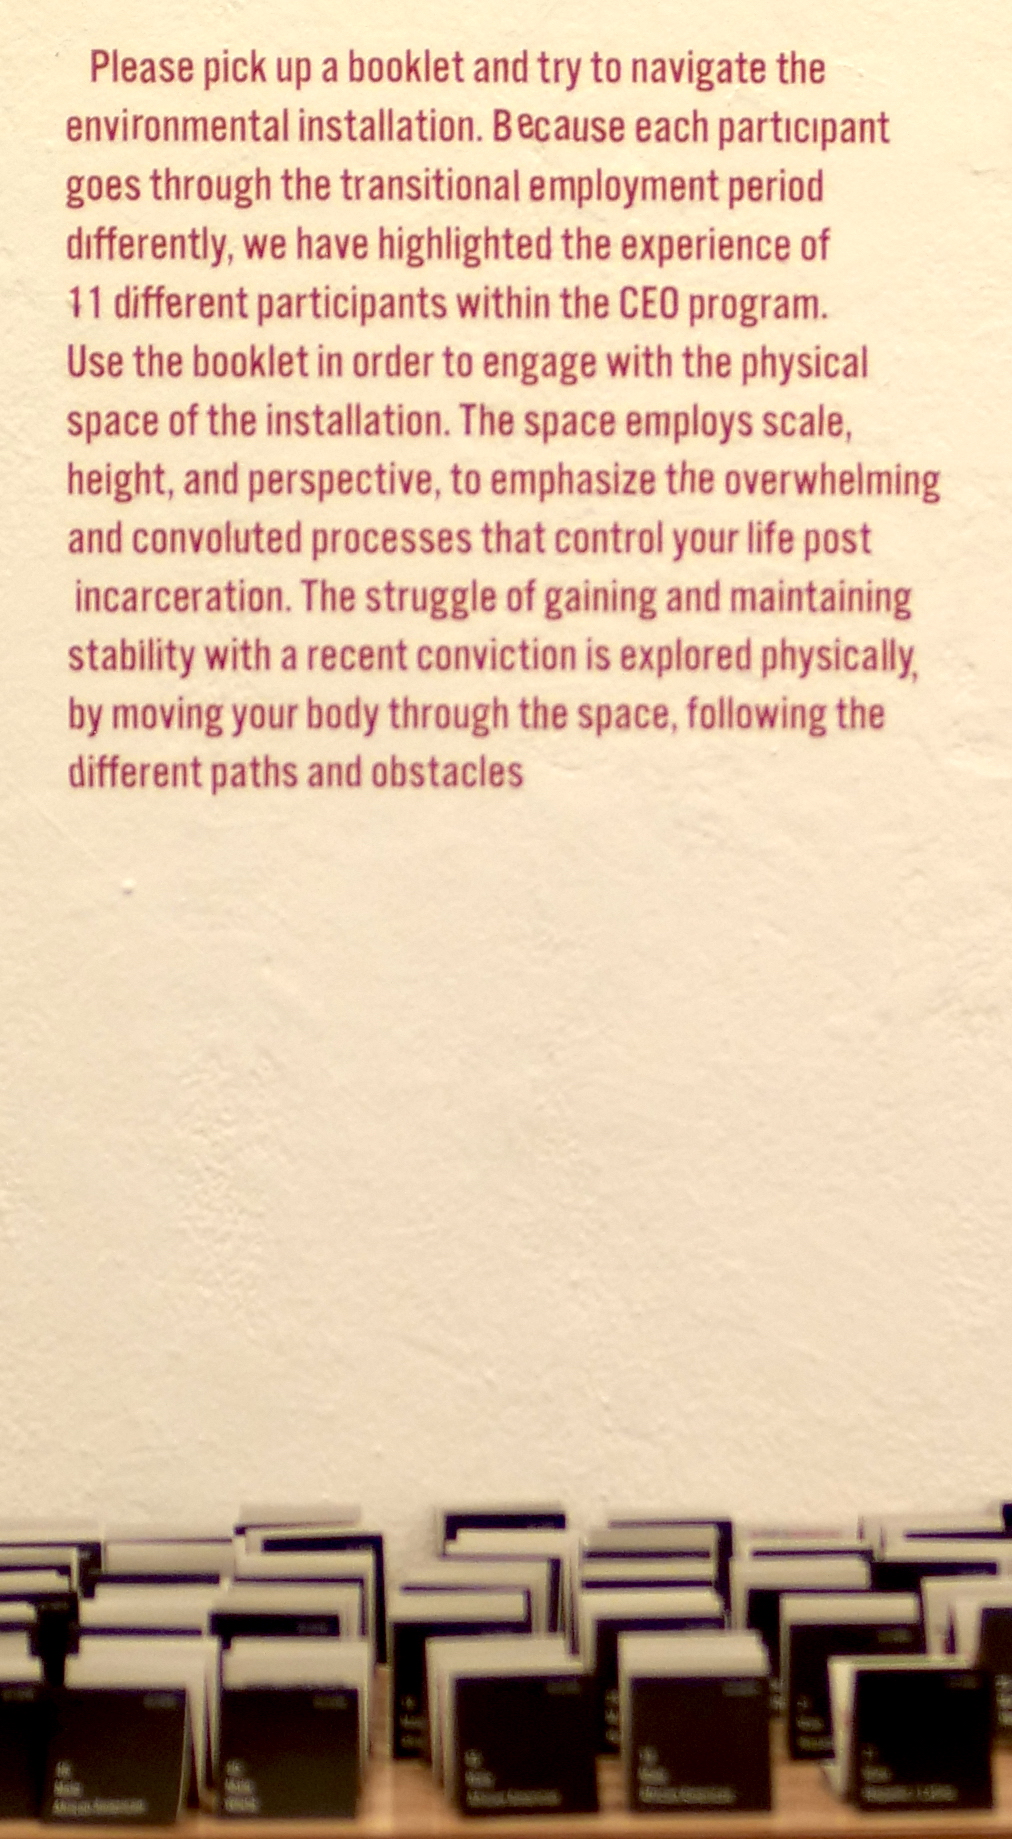
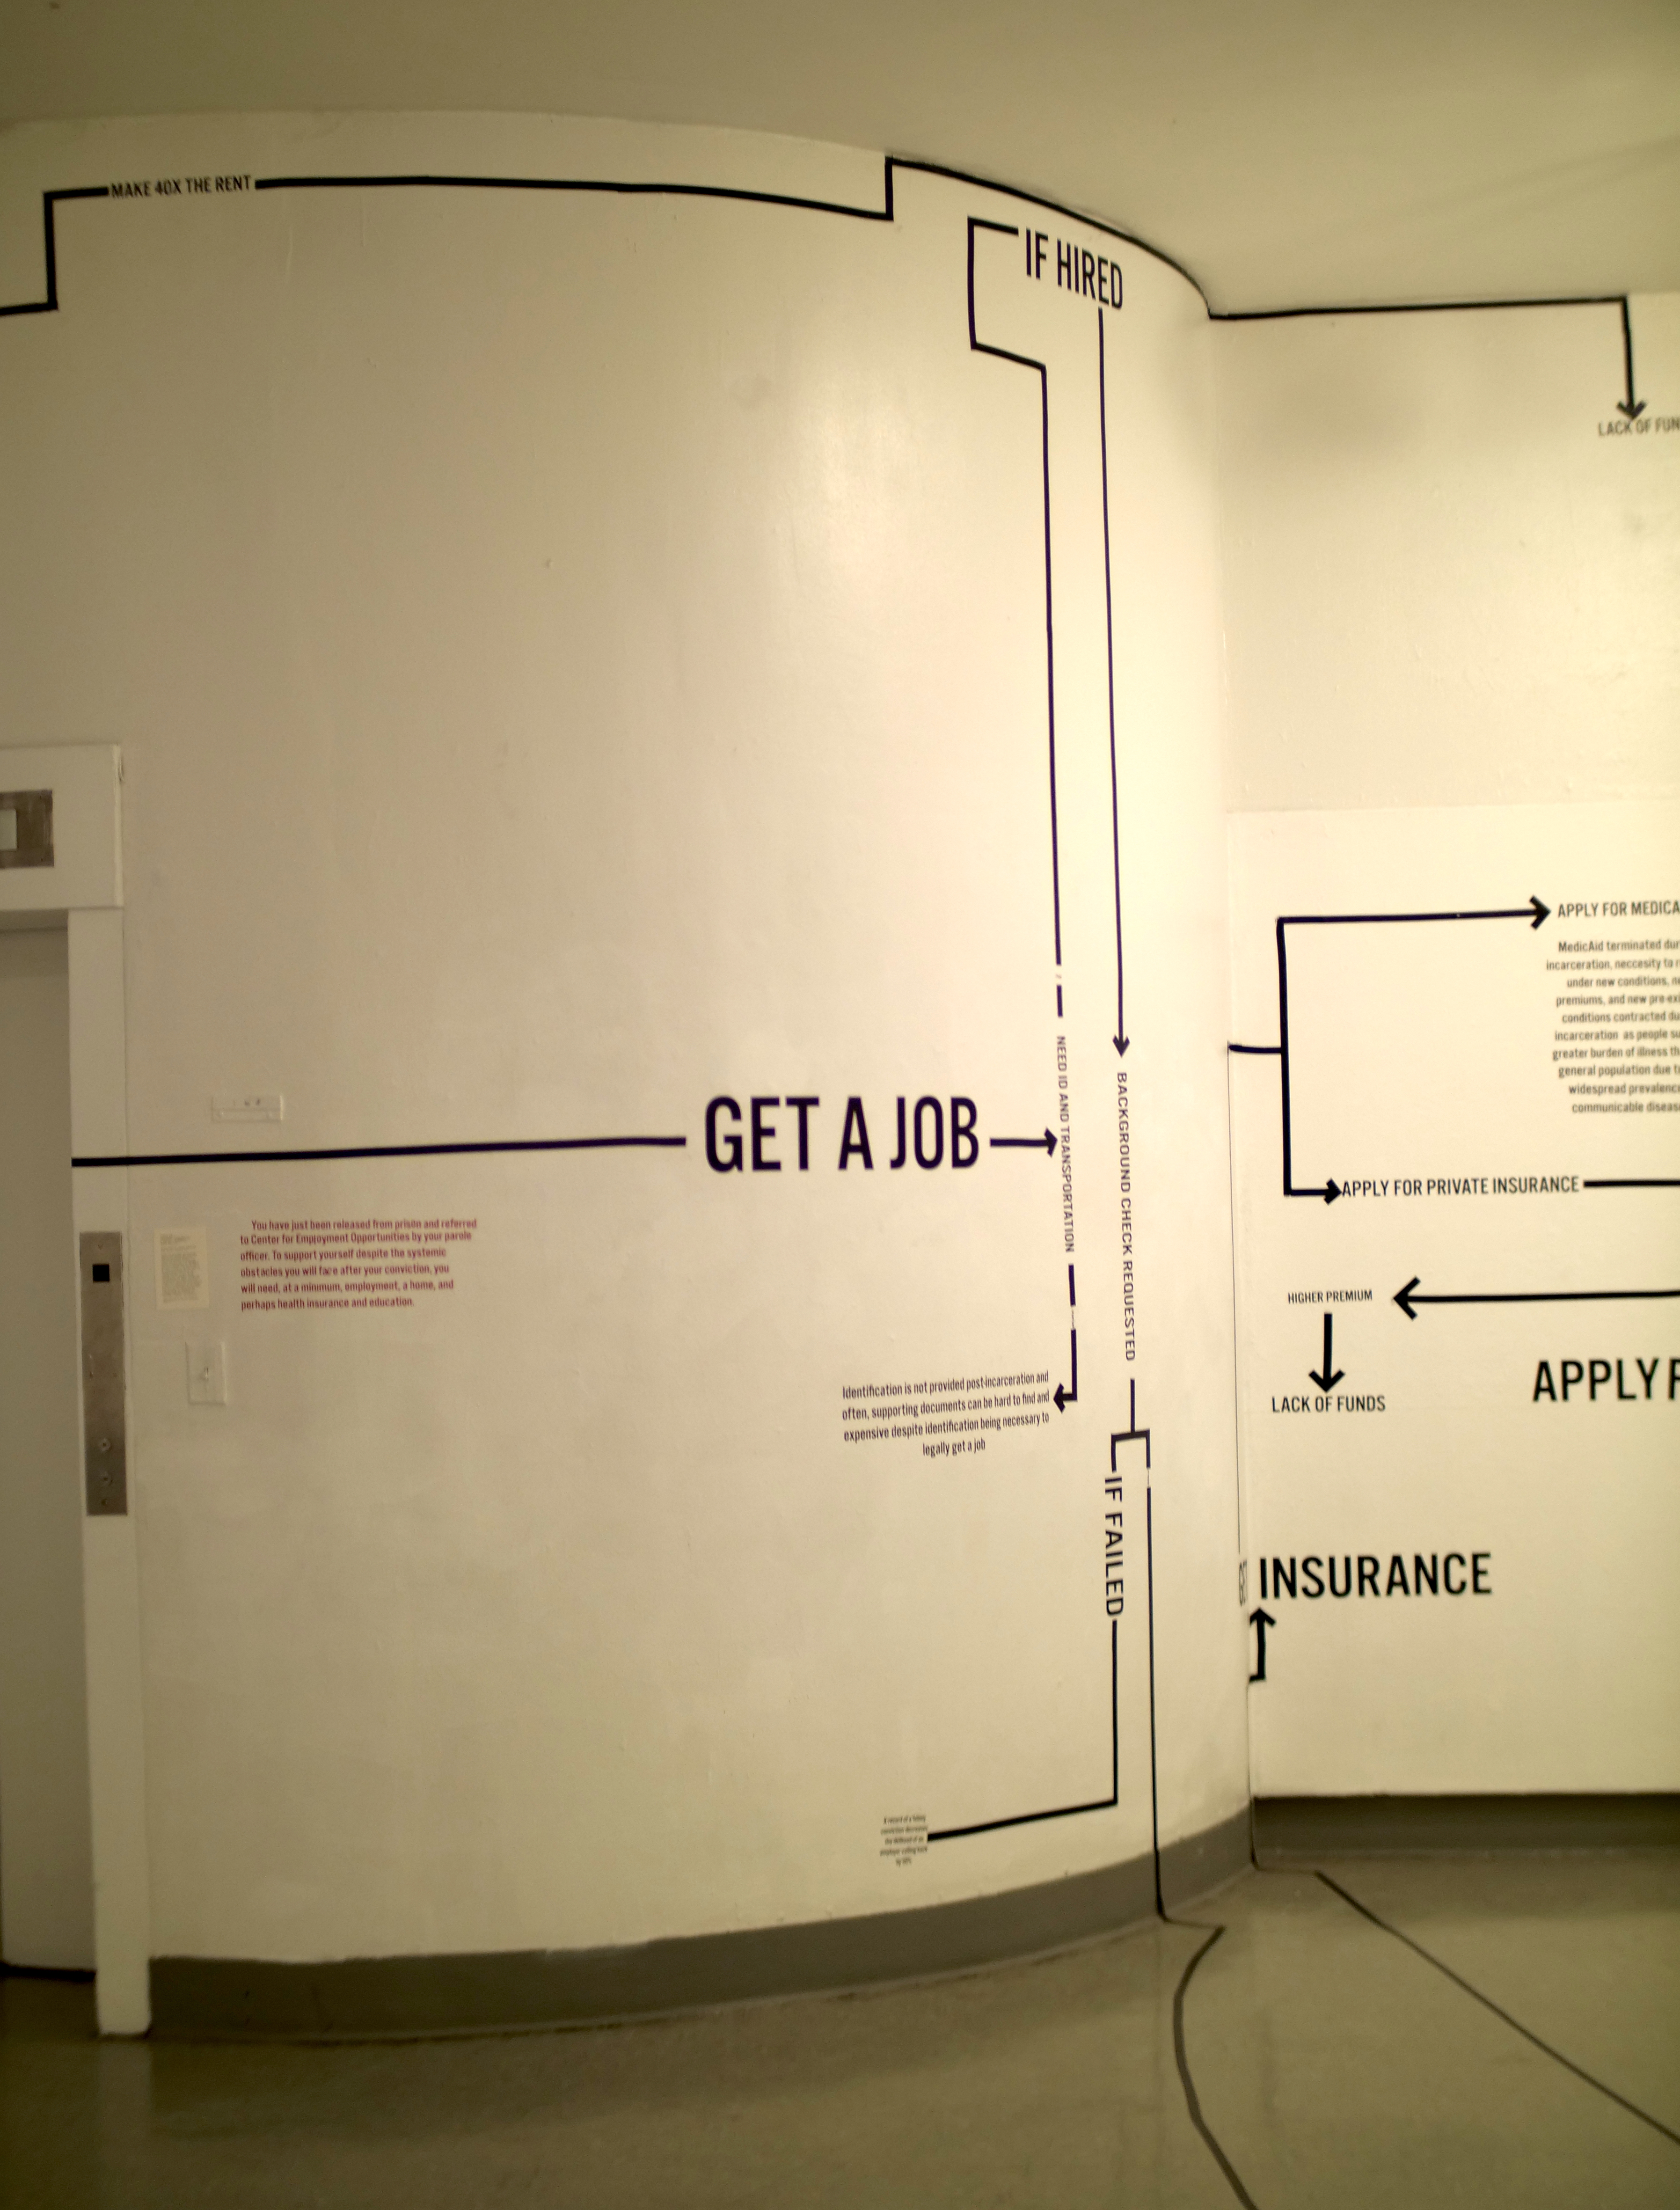
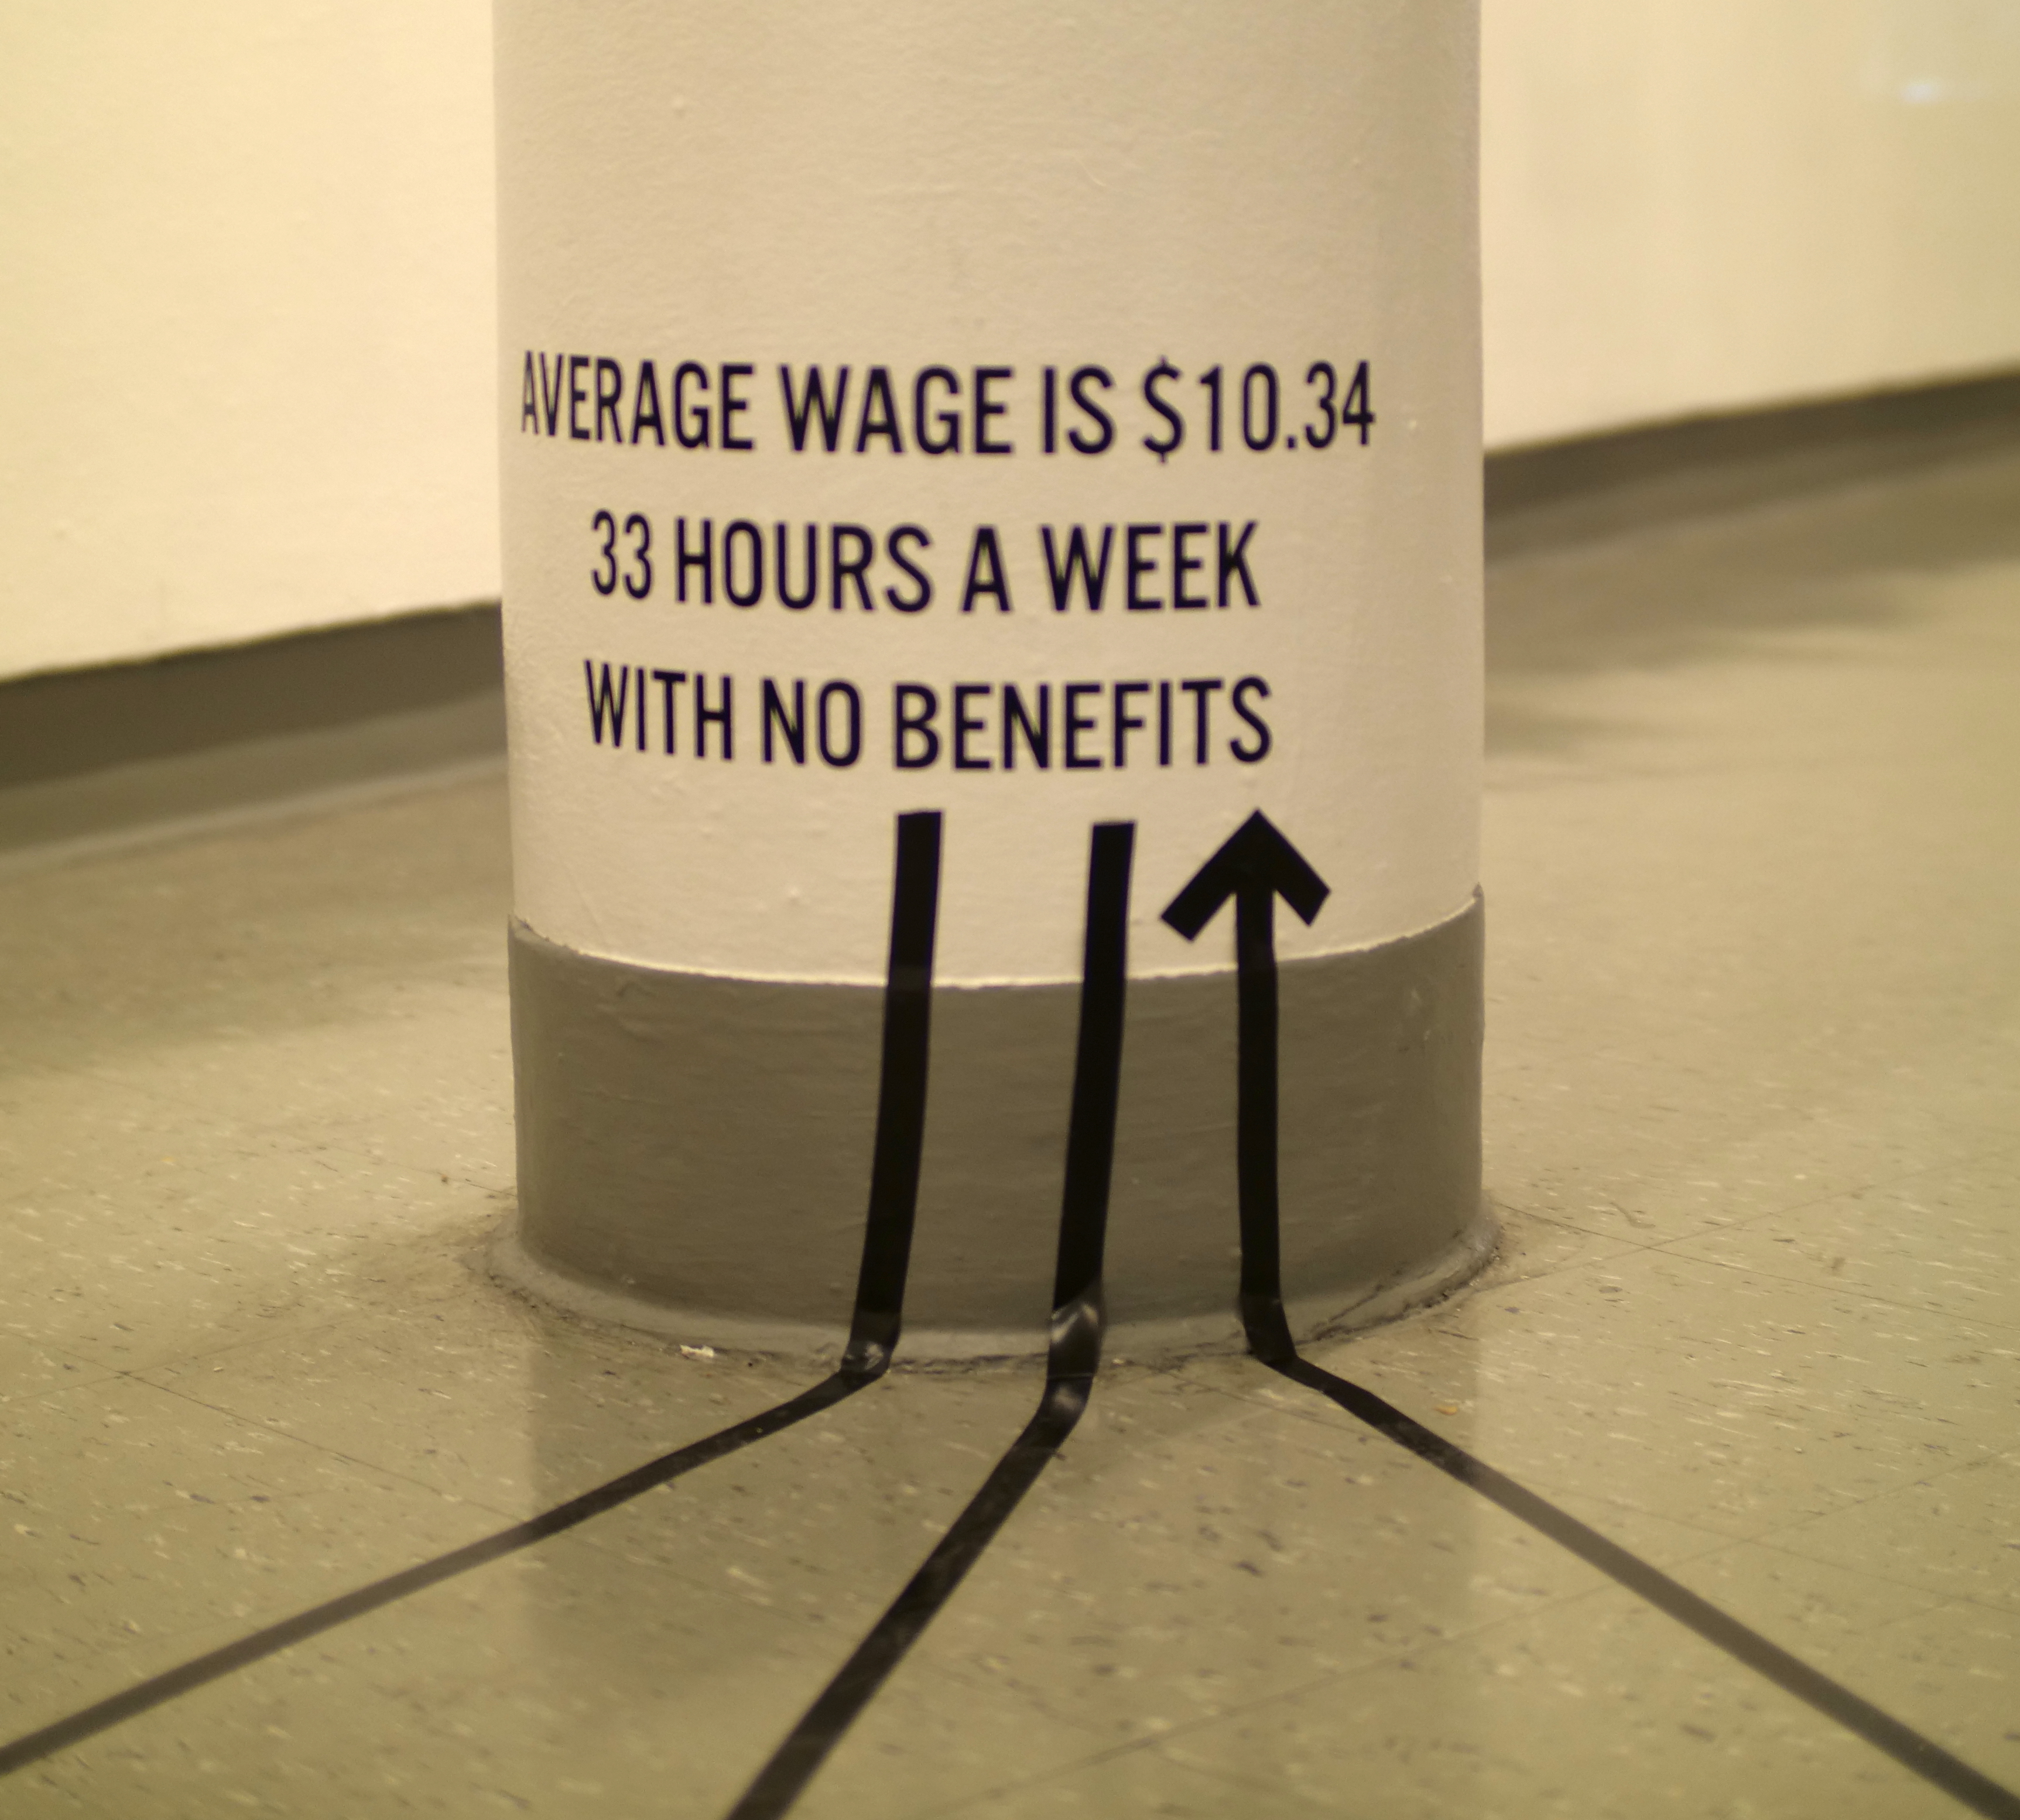
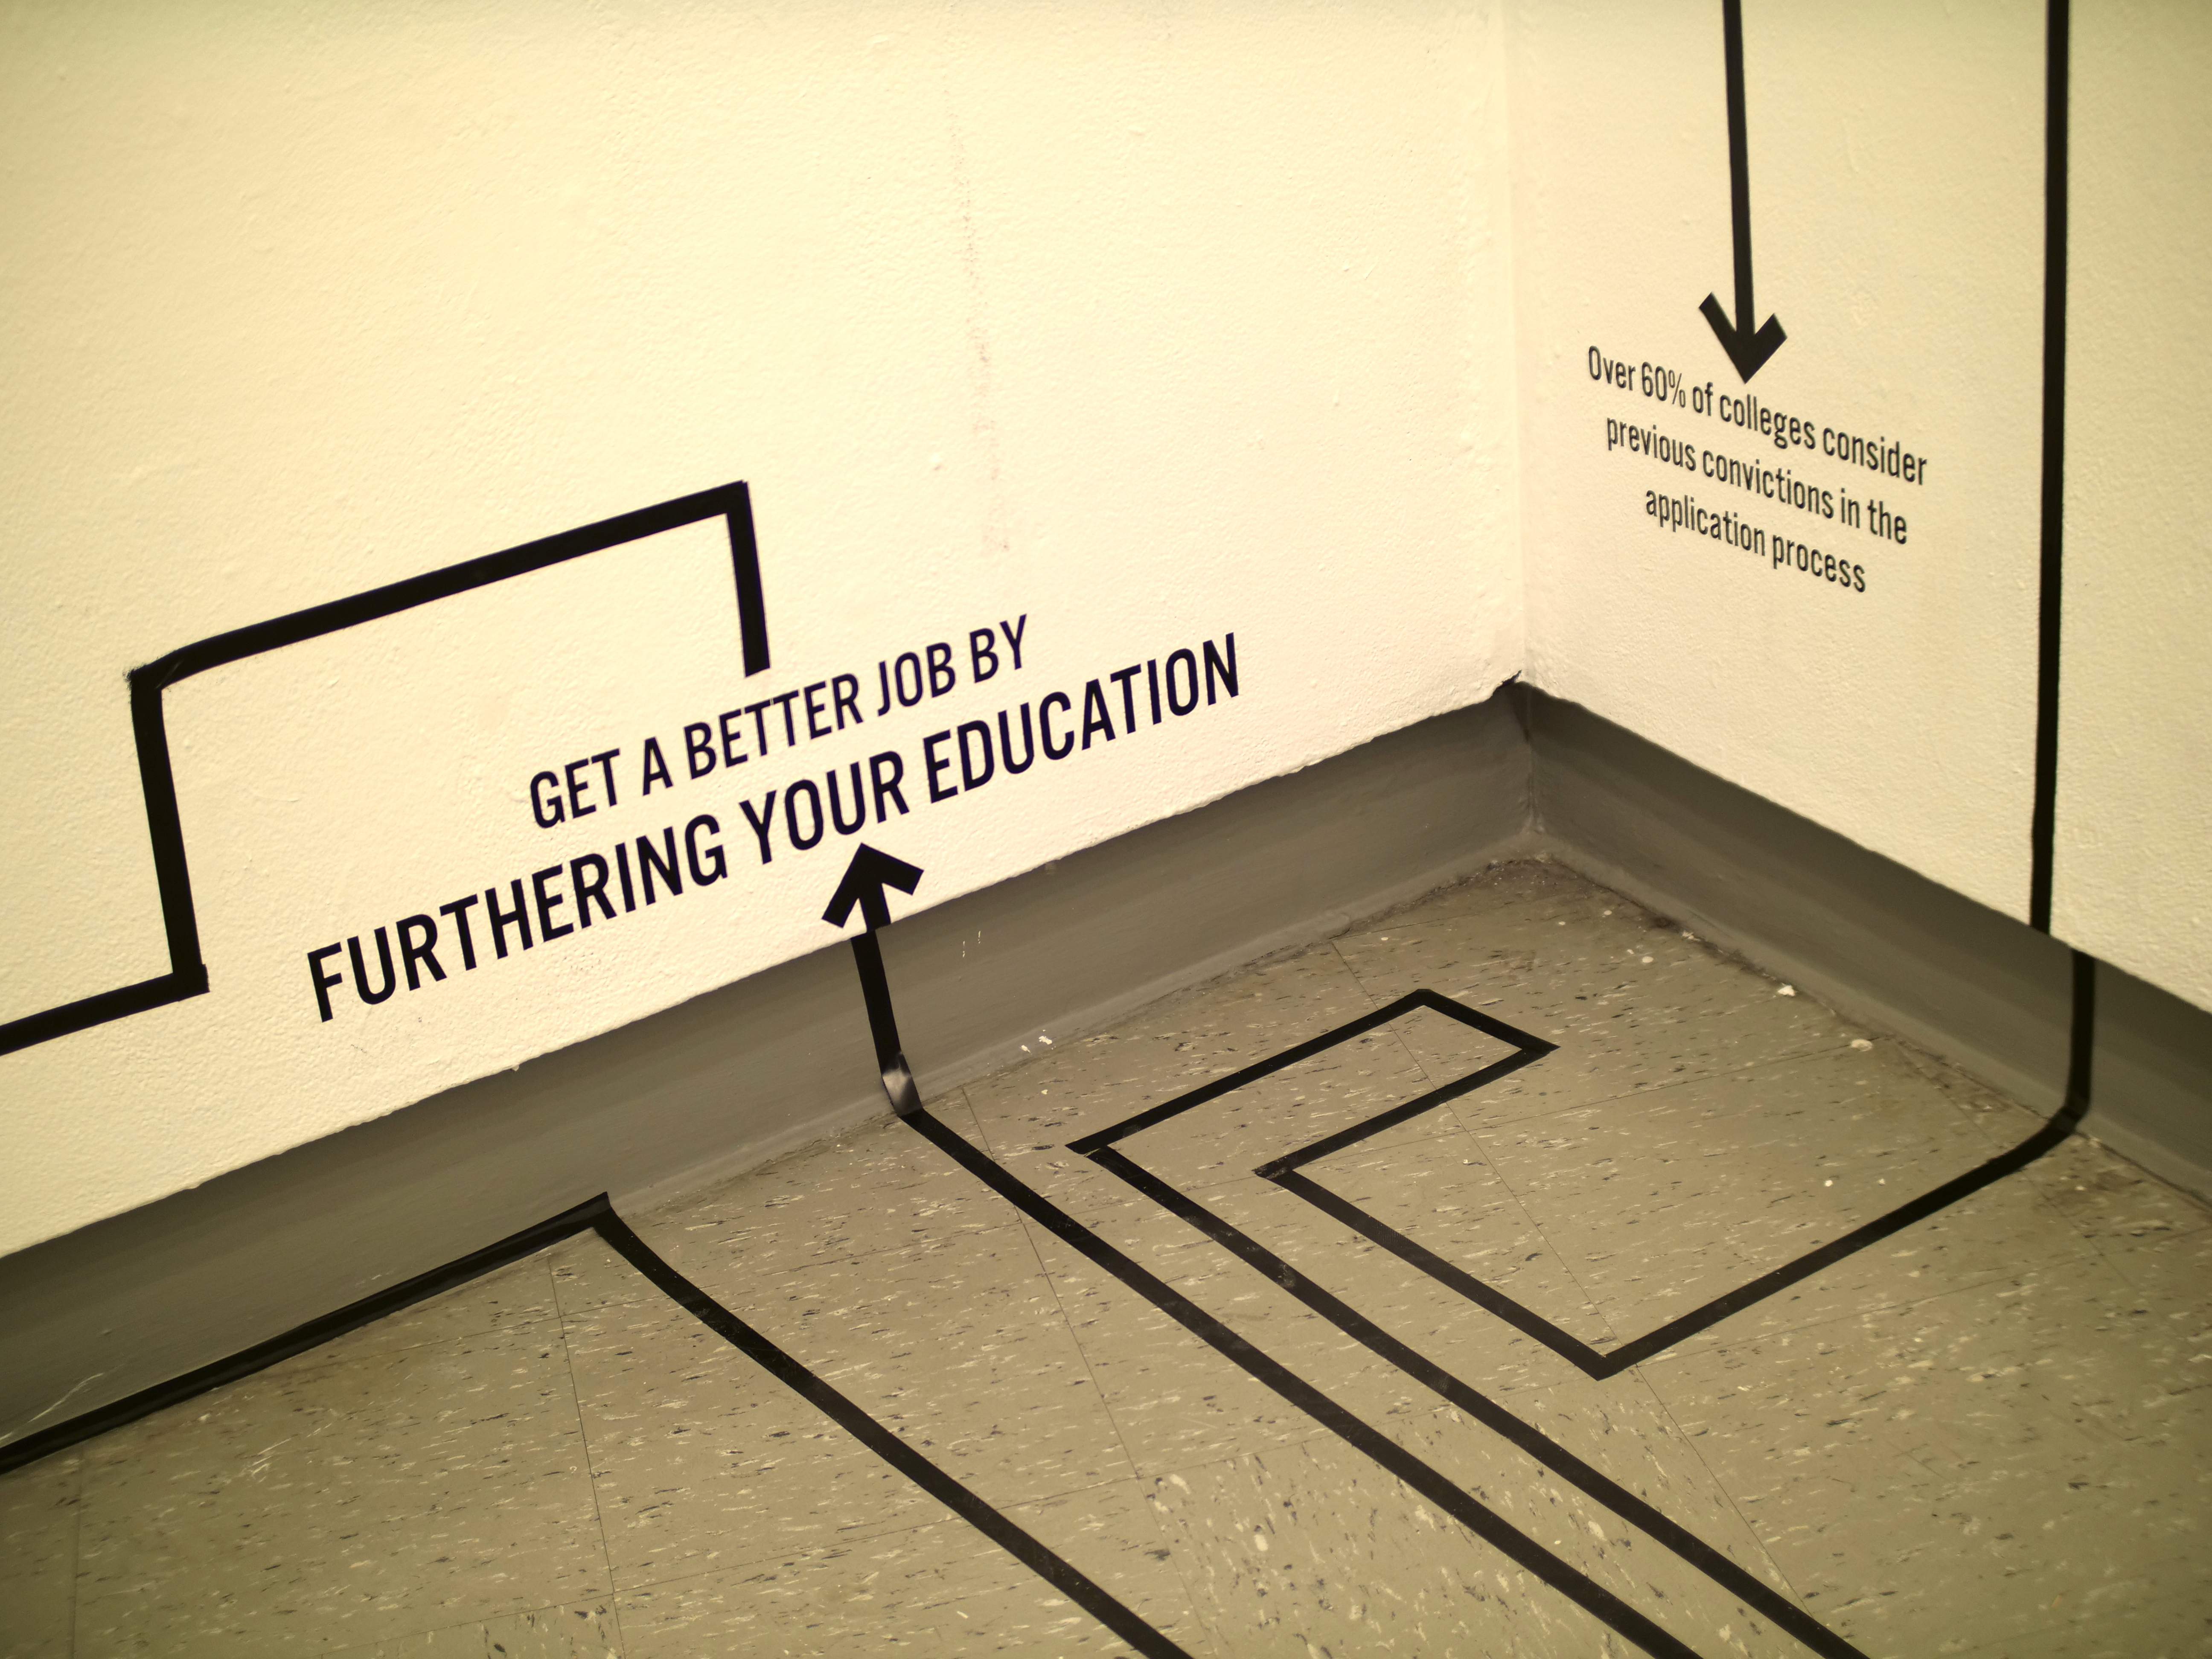
Finally, a groups of students a dataset provided to us by the [Center for Employment Opportunities](https://ceoworks.org/). CEOs mission is to provide immediate, effective and comprehensive employment services to men and women with recent criminal convictions. CEO shared with us a dataset related to the participants in their program as they try to find full-time, post-incarceration employment. This dataset inspired a large installation in the lobby of the 6th floor of The Foundation Building.
At its core, the work is a flowchart, that walks the viewer through the challenges one experiences while reintegrating into society after being incarcerated. The layout of this forces the viewer into uncomfortable, difficult positions, where they must squat, or strain in order to navigate the various obstacles.
Students: Aden Bailey, Ariana Freitag, Sophie Schneider