---
layout: post
title: "Data Science Projects for Social Good, Spring 2018, Food Insecurity"
date: 2016-6-3 03:32:51 -0500
categories: jekyll update
permalink: dspFoodInsec2018.html
---
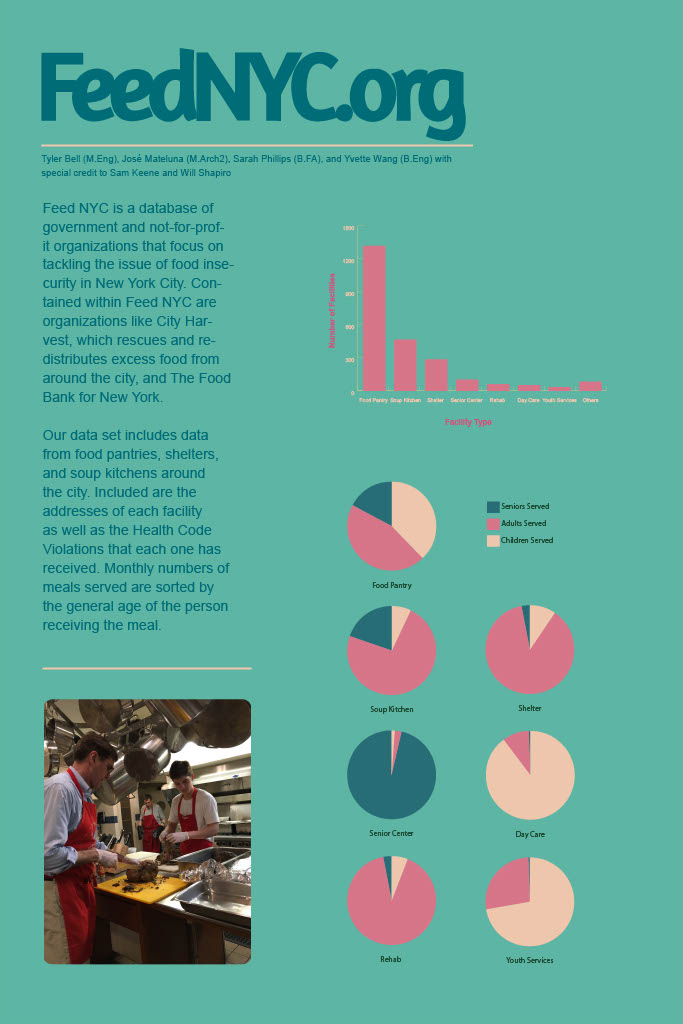
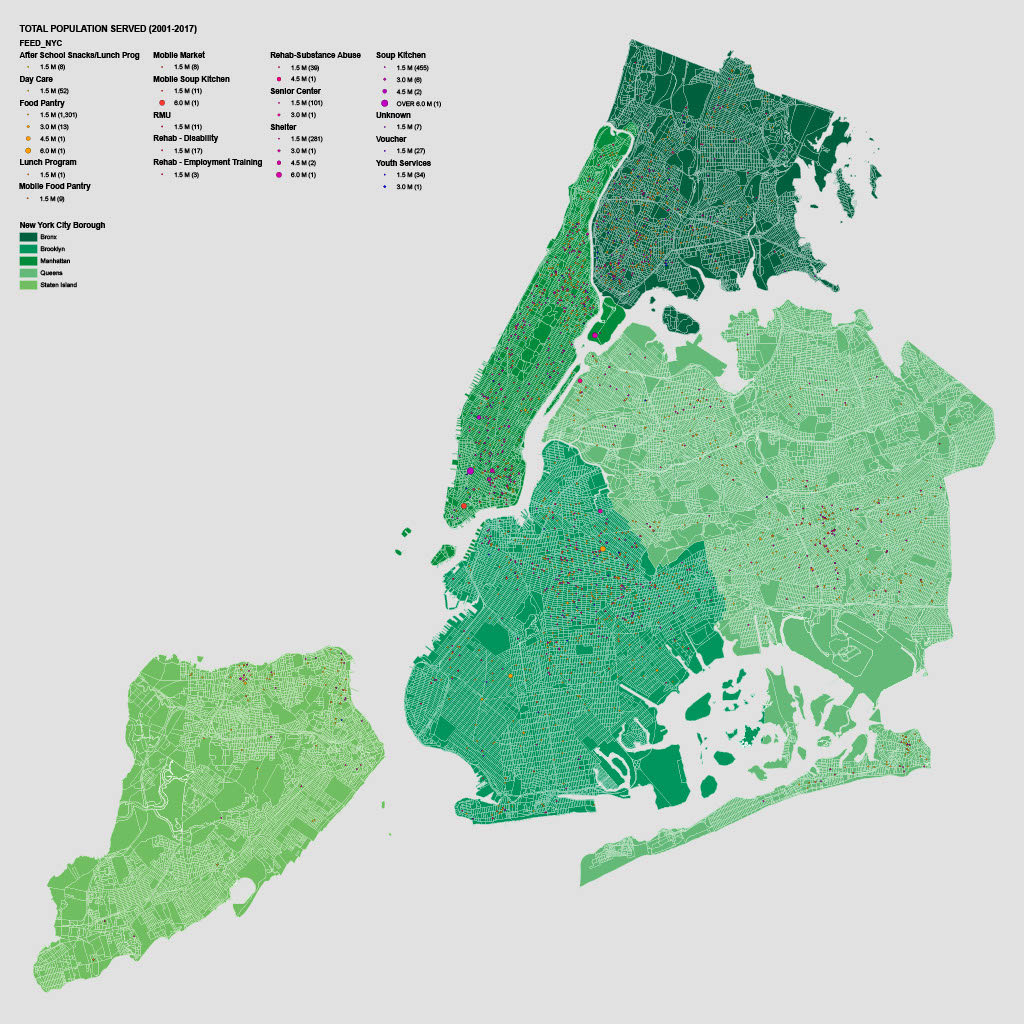
Two student groups worked with a dataset provided to us by [City Harvest](https://www.cityharvest.org/) and [FeedNYC](http://www.feednyc.org/), two organizations dedicated to eliminating food insecurity in New York City. They shared with us a dataset of the locations of every food pantry, soup kitchen, etc, in New York City. This dataset included how many meals were served on a monthly basis, and indicated how many were served to single people, families, seniors, etc.
## Group 1
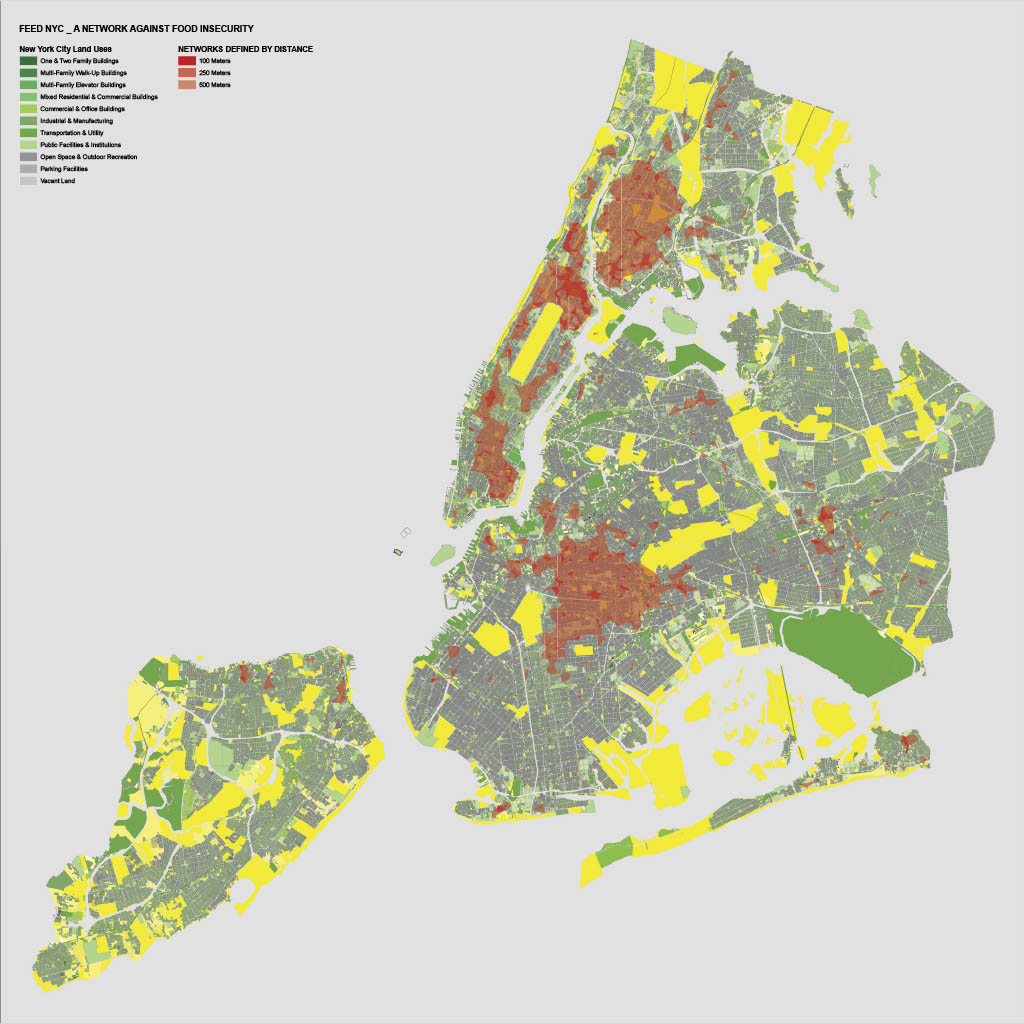
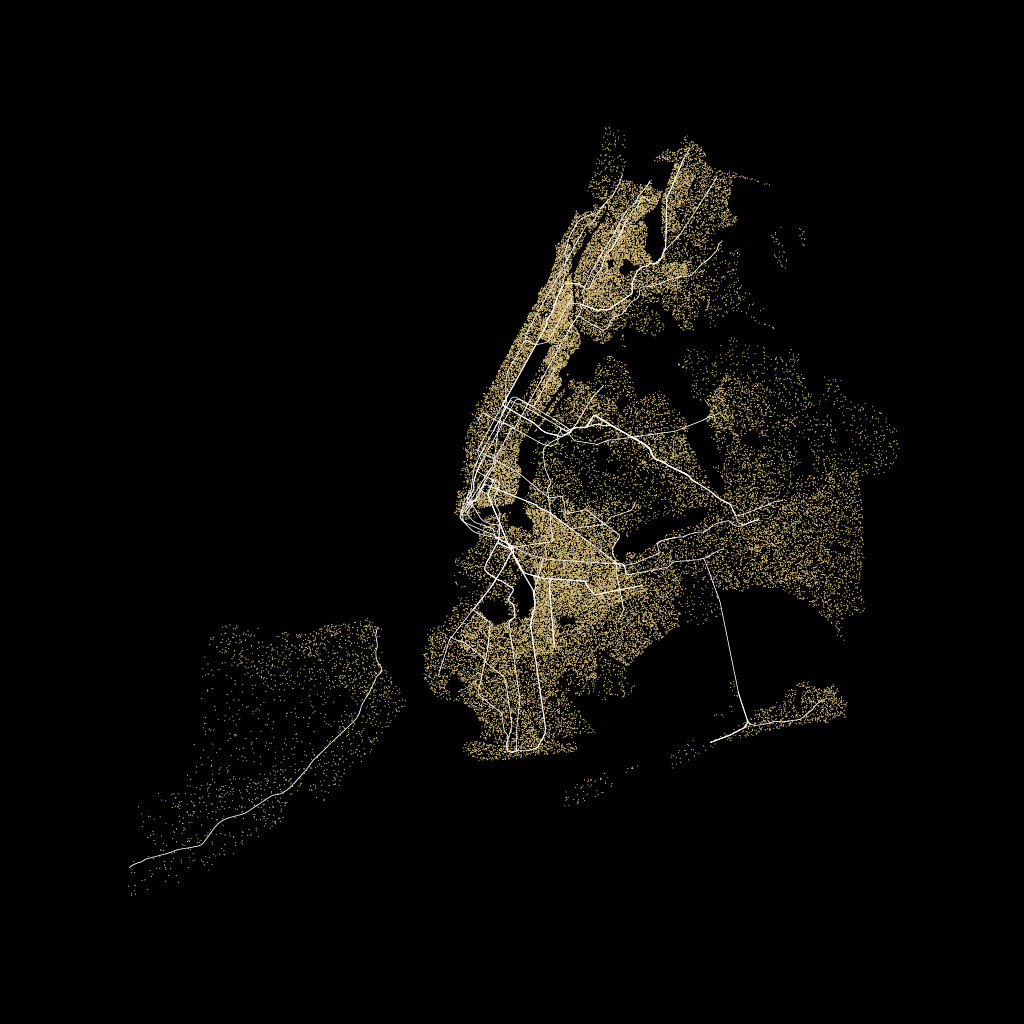
Tyler Bell(EE '18, ME '19), Jose Perez(mArch '19), Sarah Phillips(Art '19) and Yvette Wang(EE '19), studied networks of facilities, with the aim of finding locations nearby each other that are able to serve food 7 days a week. They discovered certain "food islands" in different areas of NYC where food is appears to be readily available to those in need.
A gallery of illustrating these food islands is shown below, an interactive visualization is [here](https://tybell.github.io/Map/prototype/), and if you want to read their full report, it's [right here](https://docs.google.com/document/d/1K34ZEZB0gkCSMHfqpEXEa2rMQHS7OIxlCoAPrATj-fY/edit?usp=sharing)
## Group 2
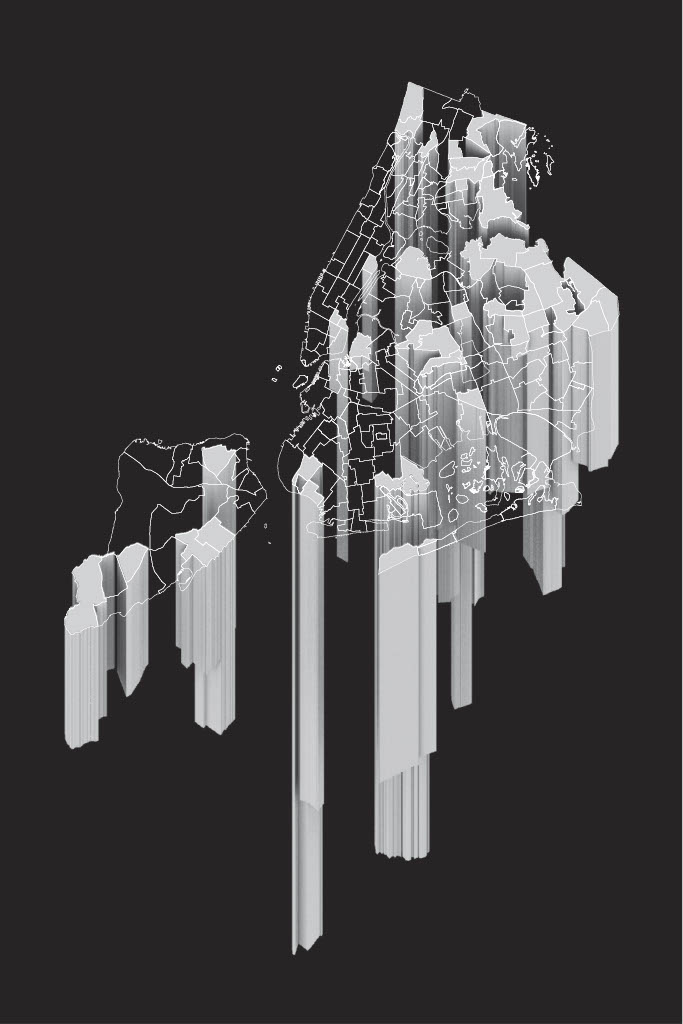
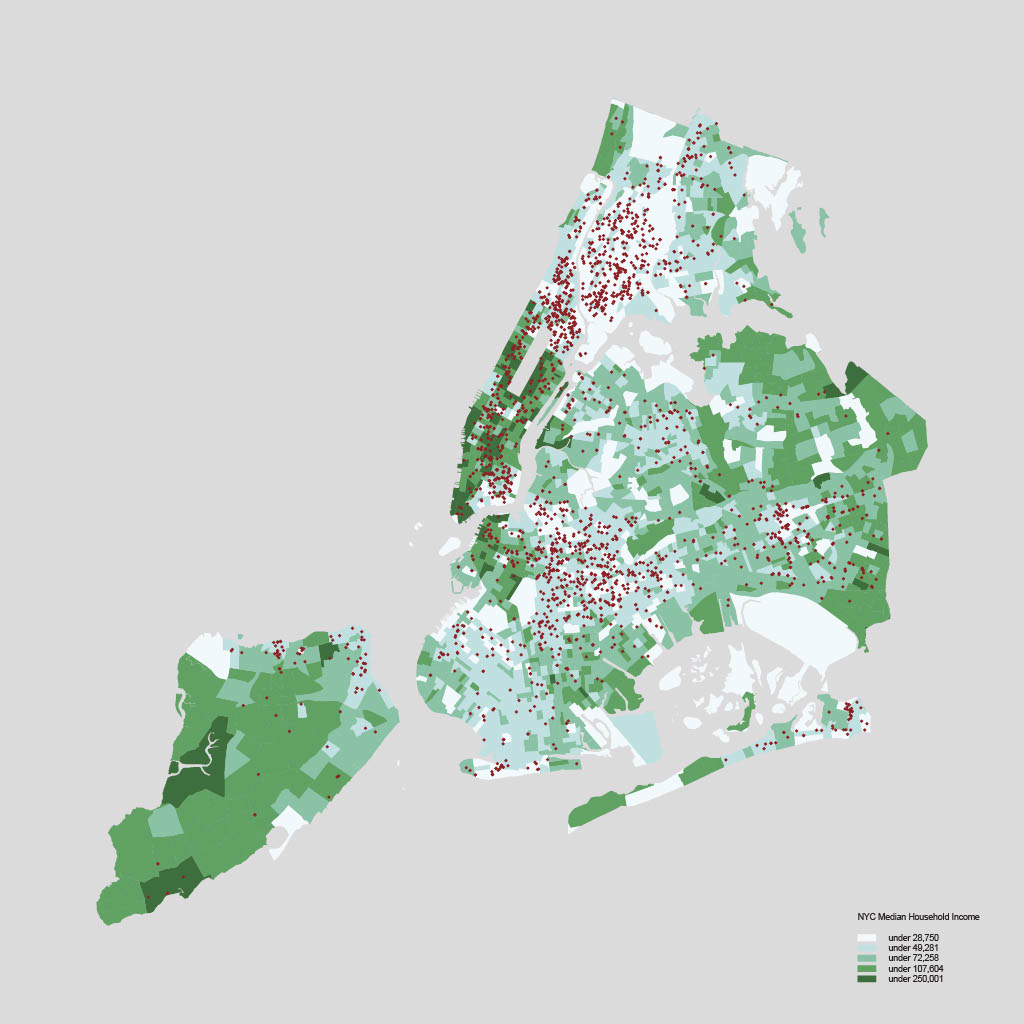
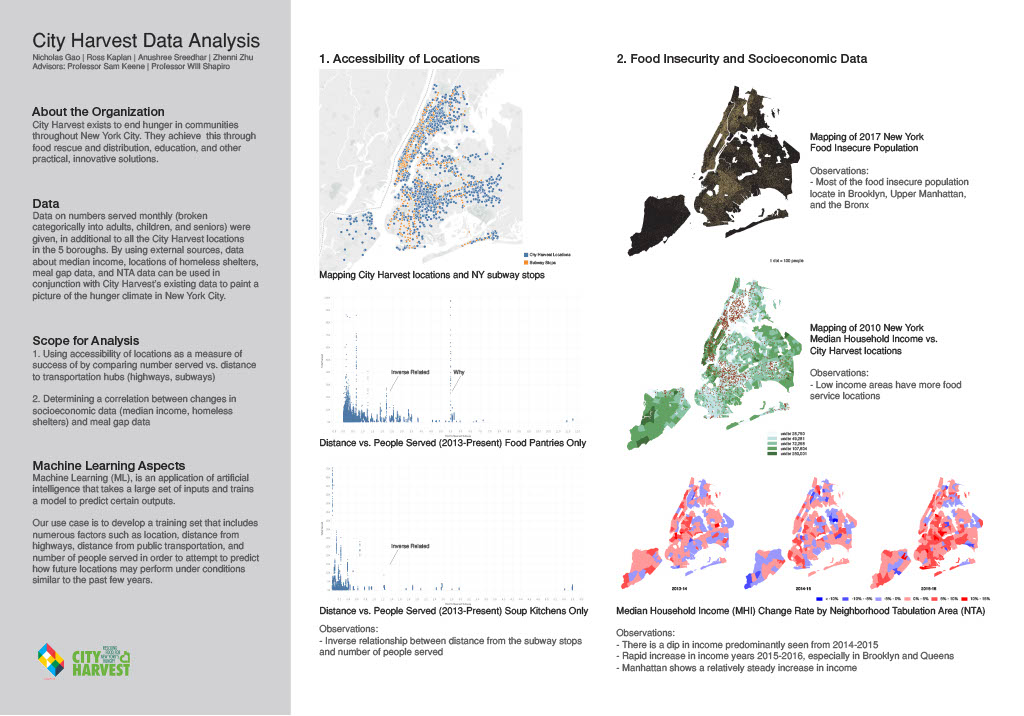
Nicolas Gao,(BSE '18) Ross Kaplan(EE '18), Anushree Shreedhar(chemE '19) and Zhenni Zhu(Arch '19) also investigated this data set. They illustrated the difference food insecurity across different neighborhoods, and developed predictive models that could potentially be used to help inform City Harvest and Feed NYC about how many people might be served if a food source were to be opened at a particular location.
Some of their visualizations are in the gallery below, and their final report is [here]({{ site.url }}/~keene/assets/City_Harvest_Group_2_Report.pdf).
## Gallery